
Understanding where data comes from, how it is collected, and why certain choices matter is fundamental to good research practice.
This module introduces the principles and practicalities of collecting high-quality, ethical, and relevant data to support effective analysis.
By the end of this module, you will be able to:
Everything around you generates data — your phone, your commute, your spending, your sleep, your university’s systems.
Understanding where this data comes from (and how good it is) is the starting point of analysis.
Your brain processes 11 million bits of data per second
Digital Trace Data refers to the traces that are left across the internet as humans communicate, coordinate, gather information, and manage their daily lives.
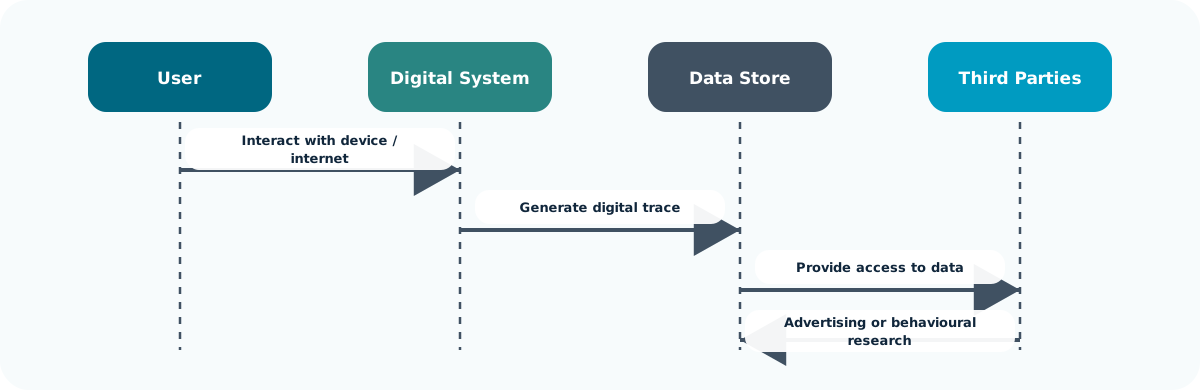
🚀 Trace data may feel passive, but it is still created, stored, shared, and interpreted through systems.
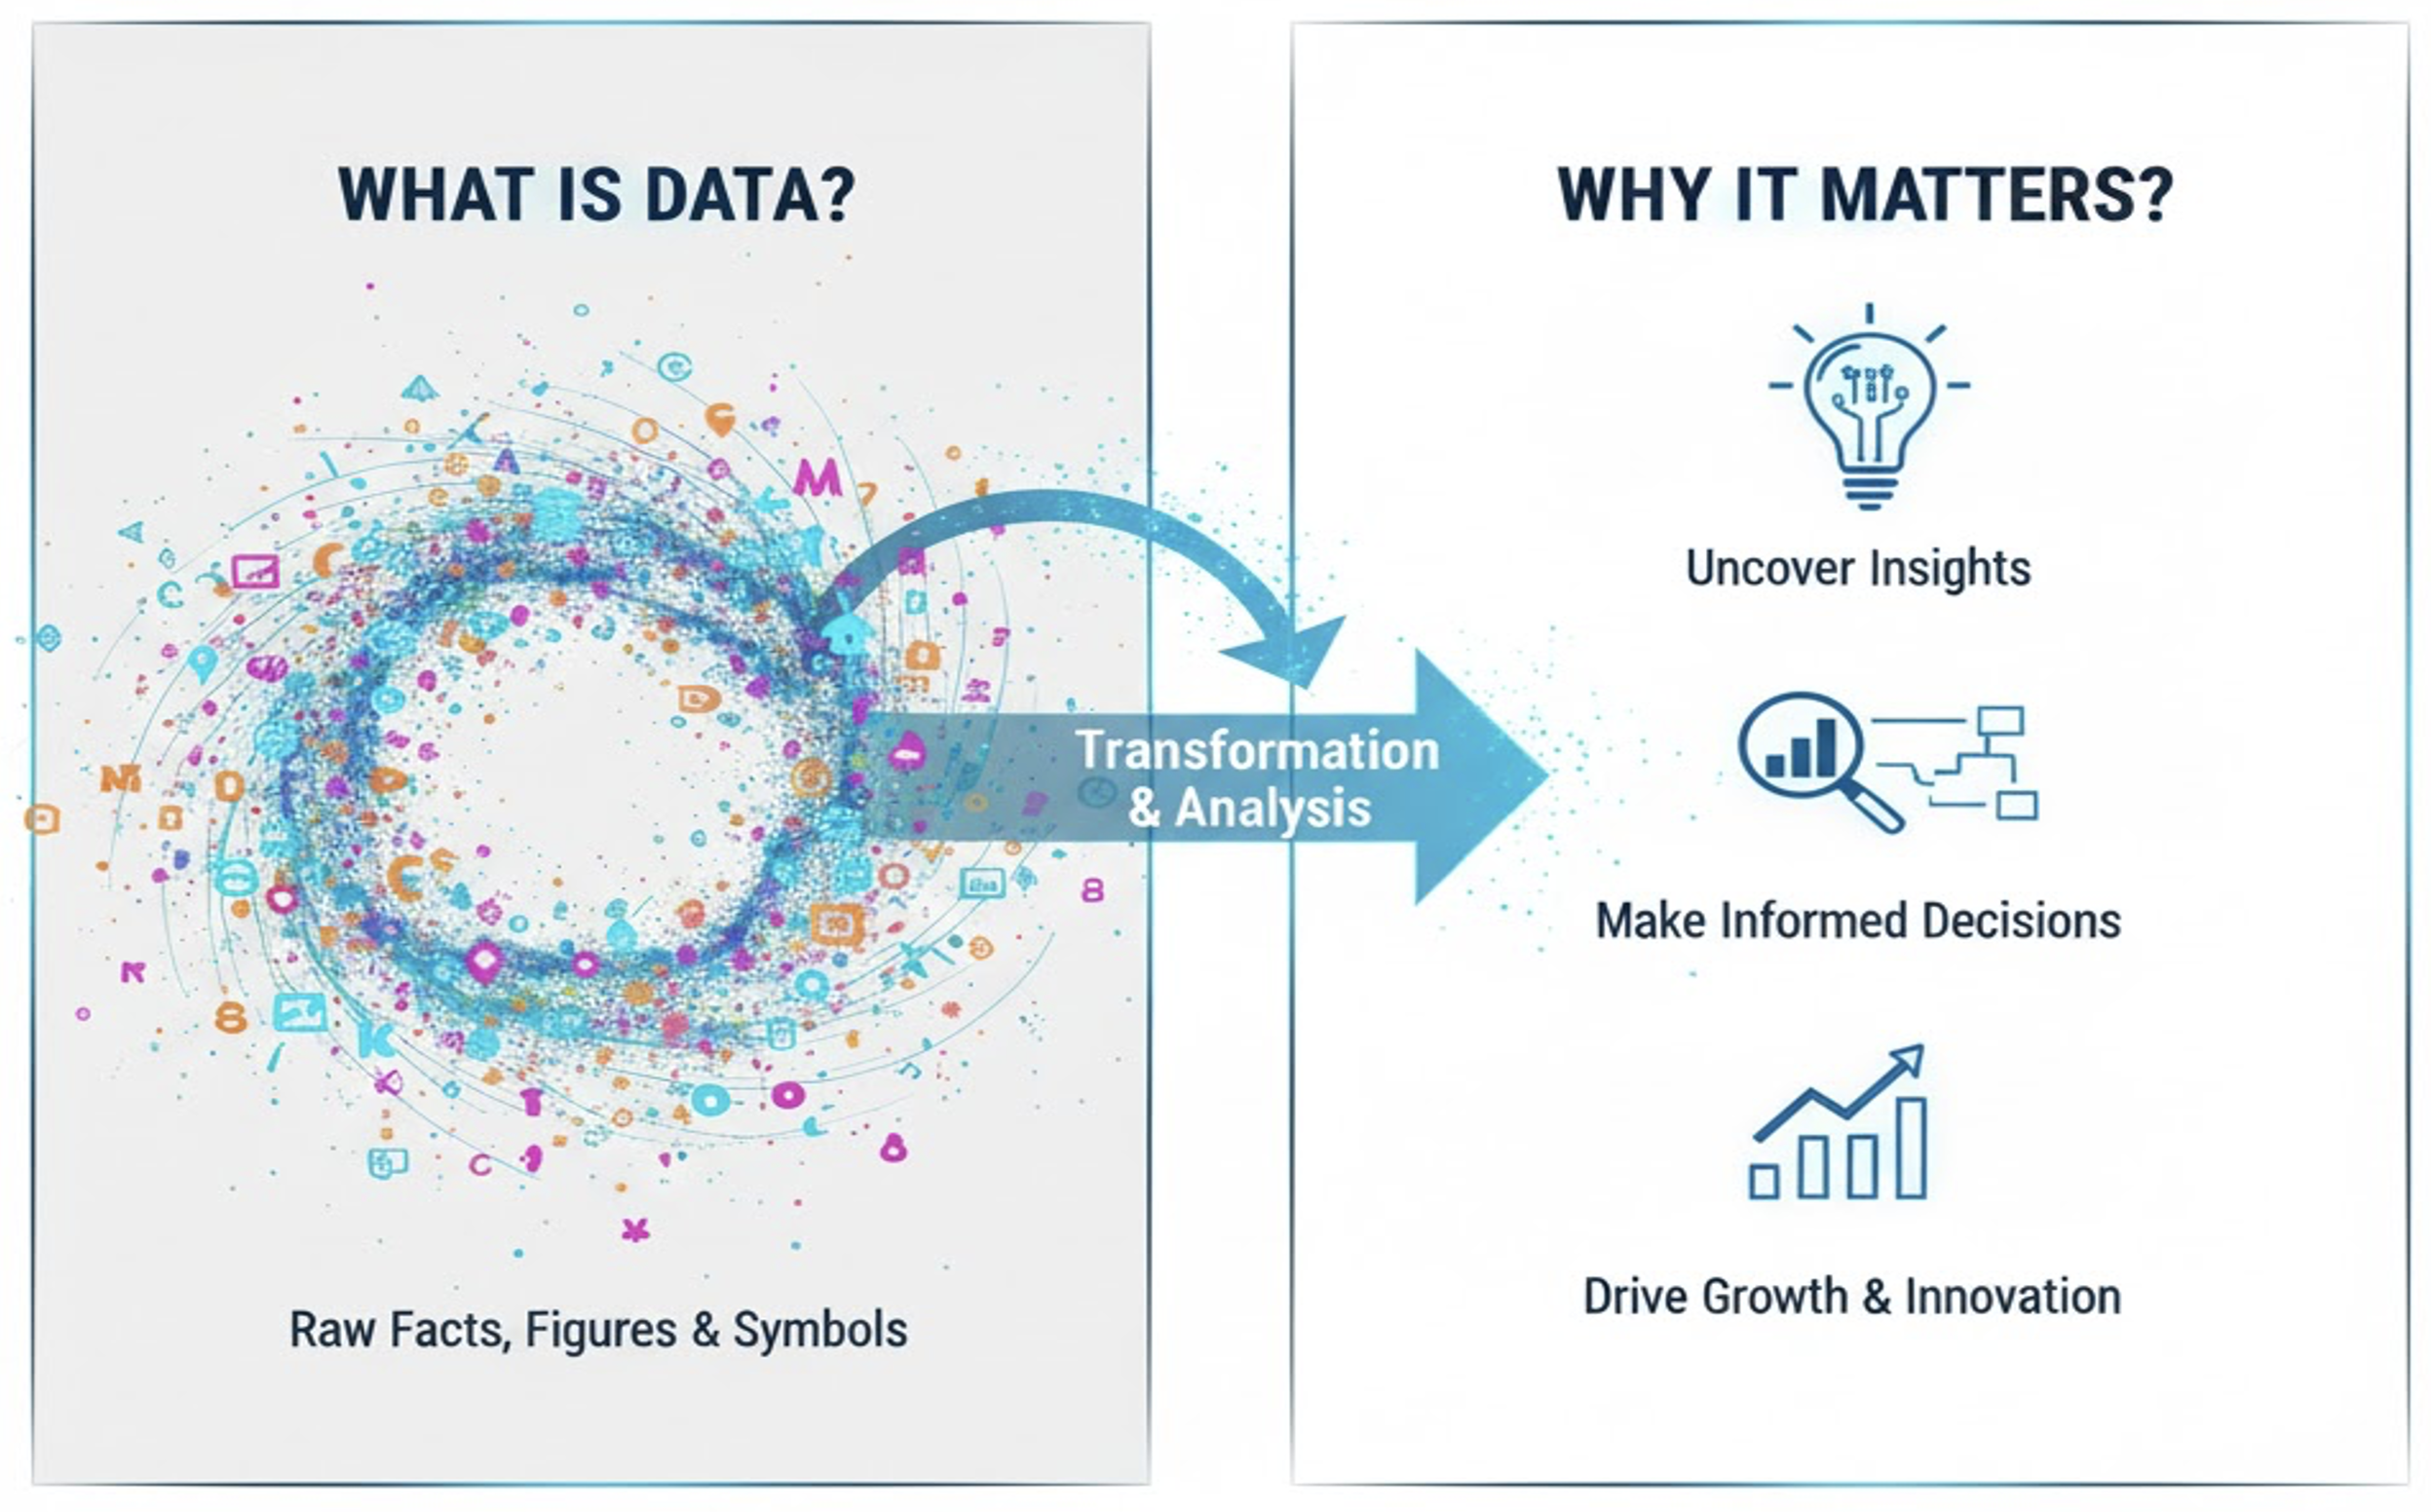
Data refers to raw facts, figures, observations, and symbols that represent various aspects of reality. It’s the unprocessed material from which information is derived.
❓ Before analysis, data is not meaningful — it becomes meaningful only after context and interpretation.

🔄 Analysis turns raw facts, figures, and symbols into information that can support decisions.
📝 Around 80% of a data scientist’s work involves preparing and cleaning data before any analysis can begin.
💯 Unlike secondary data, which relates to the past, primary data captures information as it happens
| Feature | Primary Data | Secondary Data |
|---|---|---|
| Control | High | Low |
| Cost | Higher | Lower |
| Speed | Slow | Fast |
| Relevance | Tailored | Variable |
| Richness | Flexible | Fixed |
✅ Primary data can provide unique conclusions and original insights that may not be available elsewhere
Part 1
Part 2
Downloaded dataset:
Compare collected primary data vs provided secondary dataset. Does it feel the same to be given secondary data?
Variables: Name, Gender, Age, Favorite Snack, Height, Home Country, Steps Walked (Yesterday), Library Usage (per week), Commute Time, Campus Transport Method, Hours Slept (Avg. per night), Student Status, Participation in Clubs/Societies, Frequency of Healthy Meals, Postcode, IMD Score
You’ve got a dataset — but do you know why you’re collecting it?
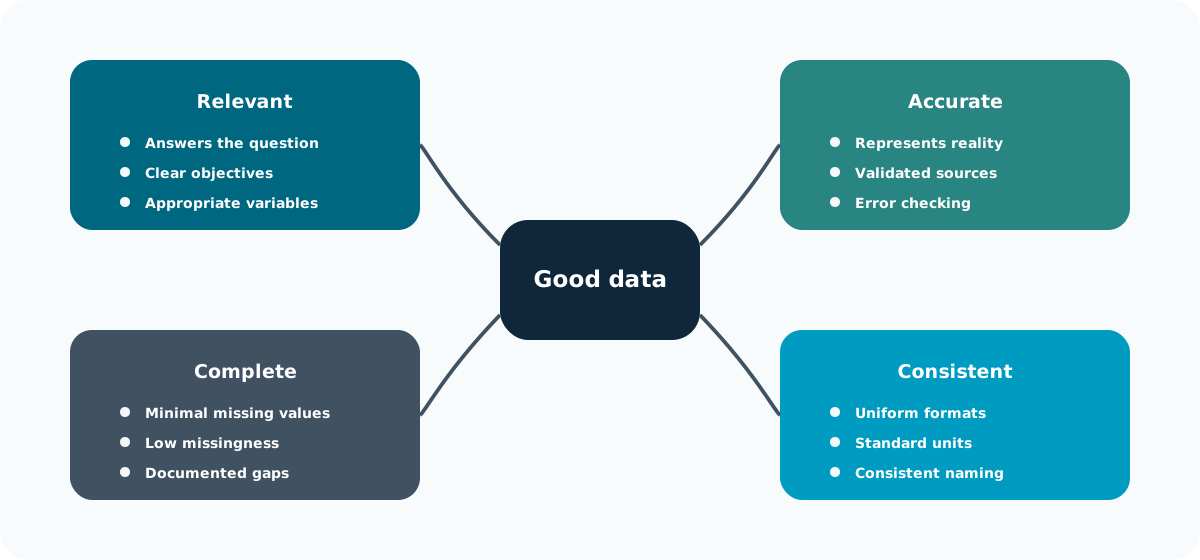
🧭 Good datasets are designed around the research question before collection starts.
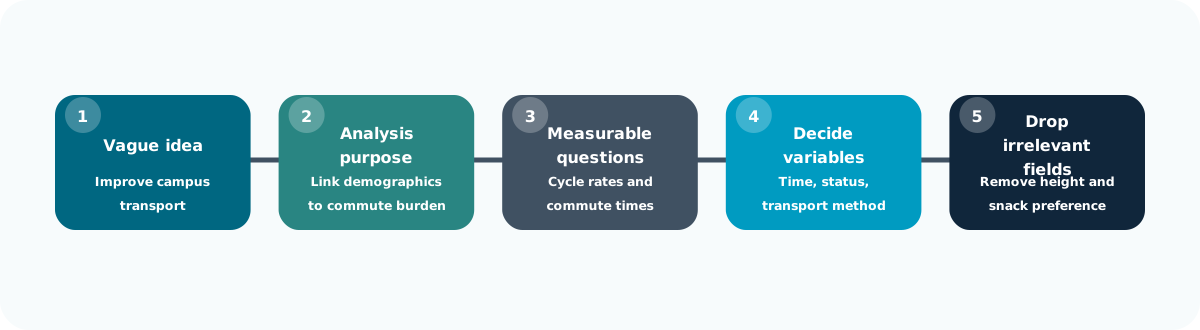
📌 Each step removes ambiguity until the data collection plan matches the analysis purpose.
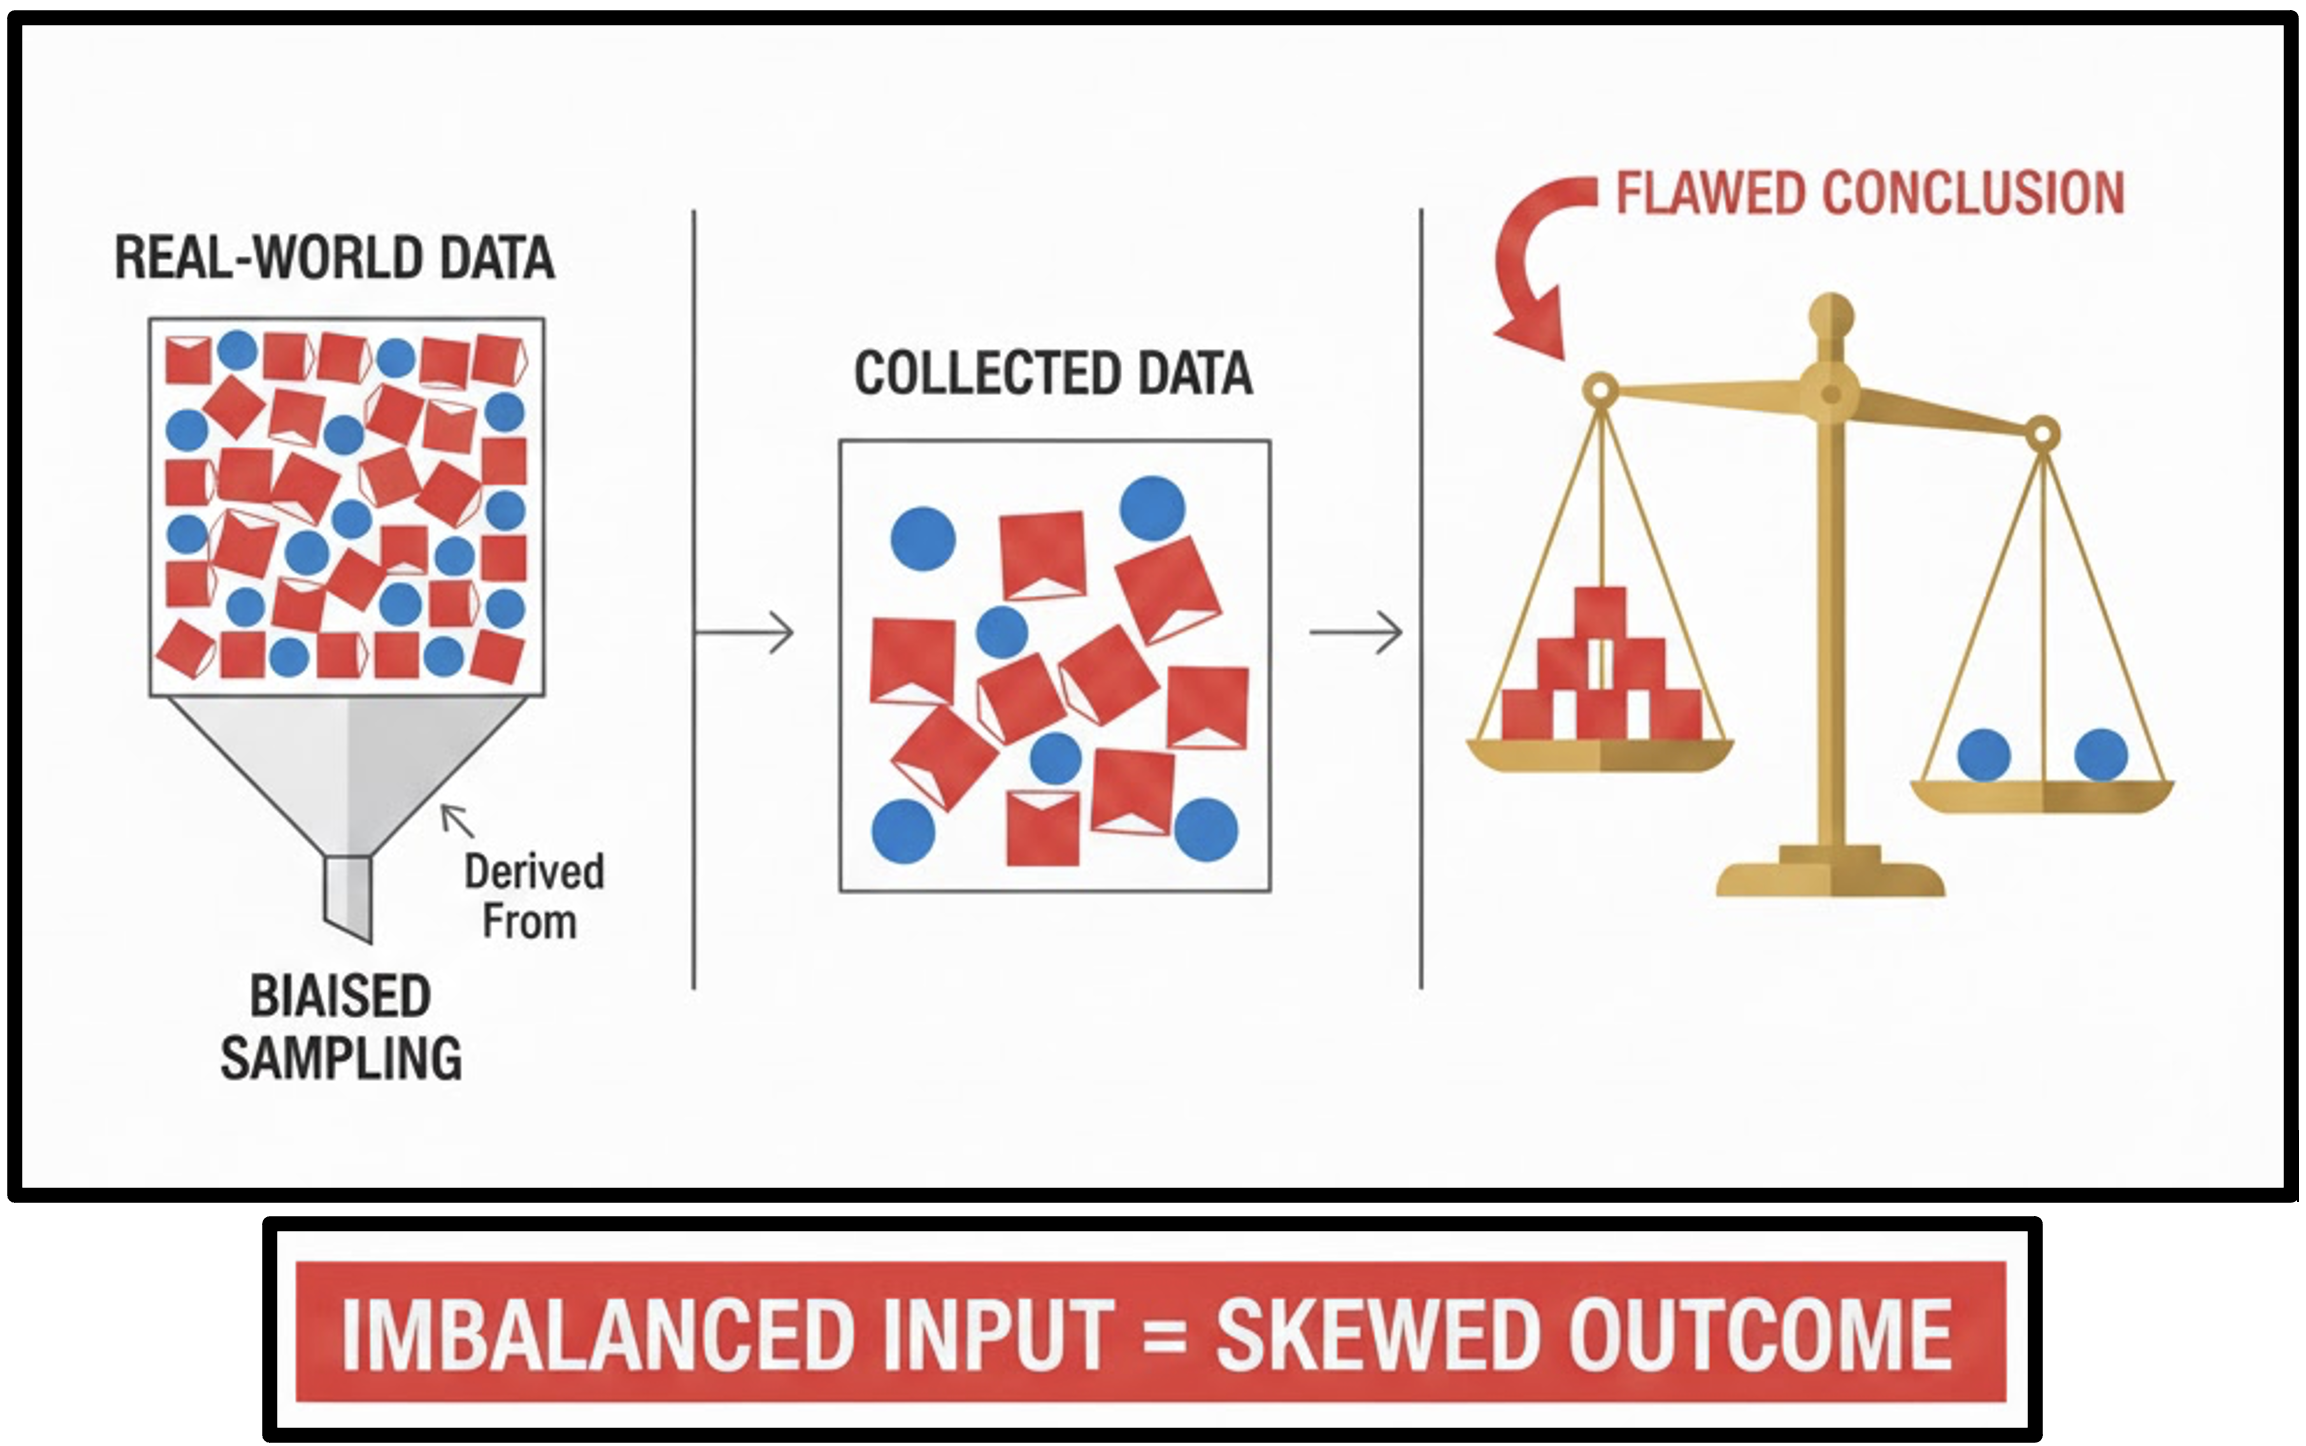
Selecting appropriate variables leads to more accurate predictions, faster processing and better understanding by focusing on what is important.
❗ Rely on expertise and previous research to identify which variables are likely to be important
🎯 Well-formed questions clarify the project’s goal and the specific business problem to be solved, preventing wasted effort!
Each group is given cards/list with possible data variables
| Data Type | Examples | What You Can Do With It | Notes / Considerations |
|---|---|---|---|
| Numeric | Height, age, step count | Calculate mean, median, range, variance | Suitable for statistical analysis |
| Categorical | Home country, snack category, student status | Counts, proportions, group comparisons | No inherent ordering unless explicitly defined |
| Text | Names, open-ended survey responses | Qualitative analysis, coding, keyword extraction | Requires cleaning (capitalisation, spelling, formatting) |
| Time-series | Dates, timestamps | Trend analysis, change over time | Useful for patterns; optional for simple surveys |
⭐ Data formats define how data is structured, stored, and interpreted
💎 Choosing the right tool depends on your data type and scale.
Tools help:
🌱 Around 80% to 90% of the data in the world is unstructured
| Tool / Platform | Best For | Example Using Our Dataset | Notes / Considerations |
|---|---|---|---|
| Excel / Google Sheets / CSVs | Numbers, text, categorical | Age, Favourite snack | Easy to sort/filter; suitable for small datasets |
| Google Forms / Survey tools | Longer text, numbers, categorical | Name, home country, favourite snack, age | Automatic data capture; directly exportable to Sheets |
| Phone sensors / mobile apps | Numeric, time-series data | Step counts, app usage data | Automatic capture; structured timestamps |
📈 Understanding your data type and analysis goal helps pick the right tool.
Now that we know different data formats and sources, lets connect them together and reinforce what has been conveyed so far!
Each group is given a deck of cards with different data formats.

⚙️ Data is powerful — but only if reliable
| Bias Type | Example | Effect on Decisions |
|---|---|---|
| Sampling bias | Only surveying morning students | Misrepresents population |
| Measurement bias | Using an uncalibrated scale | Inaccurate estimates |
| Selection bias | Surveying only volunteers | Inflated engagement measures |
| Confirmation bias | Leading questions in satisfaction surveys | Skewed responses |
🎭 This occurs when you only look at the data that “survived” a process, ignoring the failures.

💡 A bias occurs due to the tendency to search for, interpret, favor, and recall information in a way that confirms or supports one’s prior beliefs or values.

Each group gets a bag of colored counters representing the student dataset: Pink = female, Blue = male
Draw a small sample and answer the following questions: What % are females? What is the average age of the females?
Compare with the total population. (40% 21.75 years)
Data is not just numerical output. Effective analysis depends on thoughtful planning, careful collection, and explicit intent, ensuring that later analyses genuinely address the original research questions.
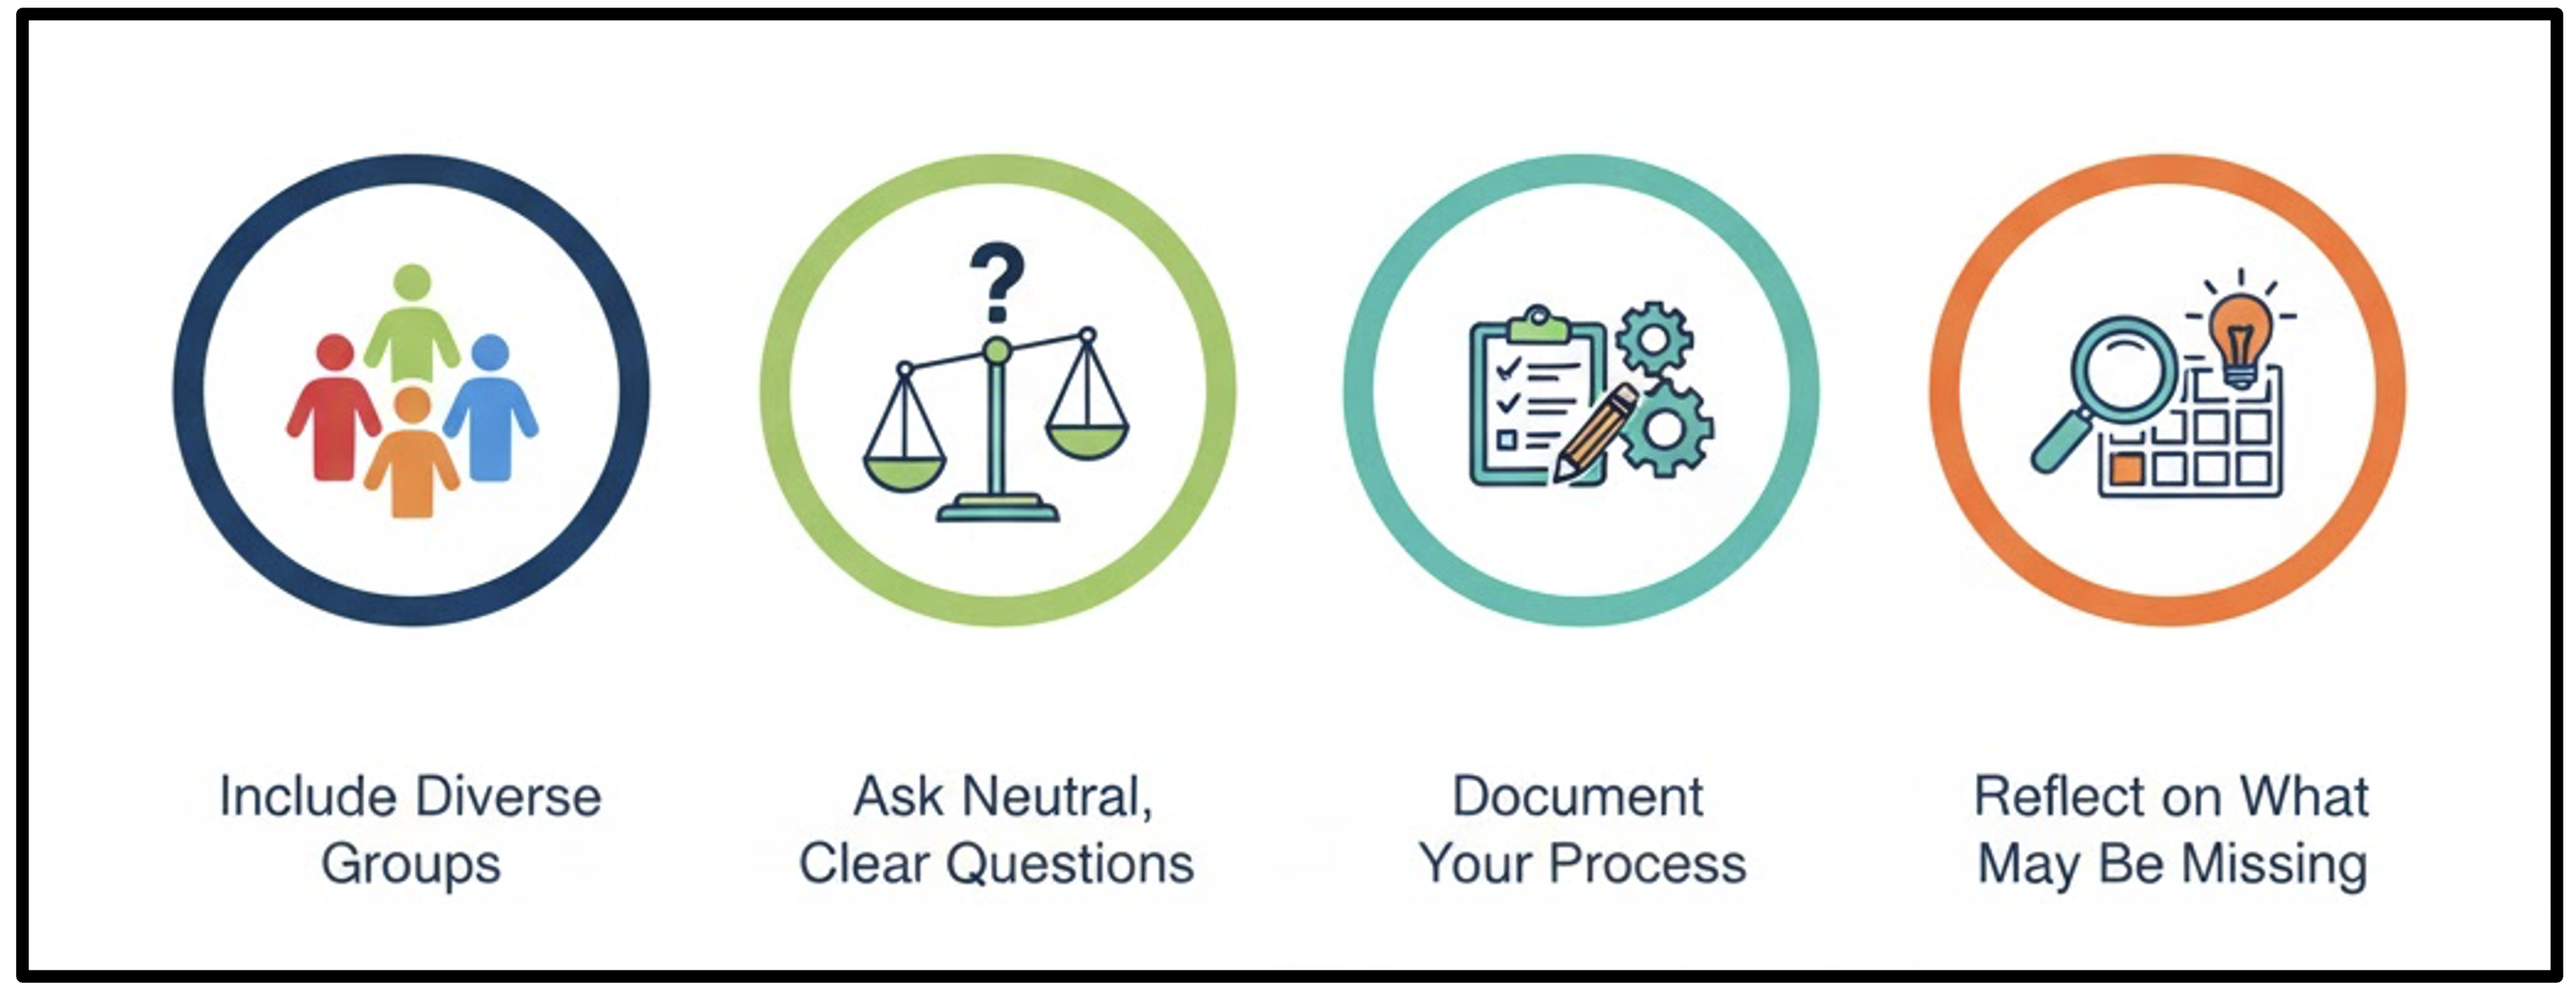
This module introduces the foundations of good data practice, emphasising data provenance, purposeful collection, appropriate tooling, and awareness of bias. The focus is on making deliberate, transparent choices so that downstream analysis is meaningful, reliable, and fair.
The concepts in this module connect directly to practical data handling in Python.
| Submodule | Python Connection | Why It Matters |
|---|---|---|
| Primary & Secondary Data | Import diverse data sources (CSV, Excel, APIs) using pandas. |
Enables work with heterogeneous, real-world datasets. |
| Planning for Good Data | Filter, select, and structure data programmatically in Python. | Reinforces that well-planned data leads to robust analysis. |
| Tools & Formats | Read and write CSV, JSON, and XLSX files using pandas. |
Supports movement between tools and reproducible workflows. |
| Trust & Fairness | Inspect missingness, imbalance, and bias using summaries and visualisation. | Encourages ethical, transparent, and reliable data analysis. |