
Data rarely speaks for itself. Before analysis can inform understanding or decision-making, it must be interpreted through appropriate visualisation, careful design, and contextual awareness. Tables of numbers may be precise, but without structure and framing they obscure patterns, exaggerate noise, and invite misinterpretation.
This module focuses on developing the skills required to make sense of data: selecting effective visual representations, critically evaluating how design choices influence interpretation, and recognising how context shapes meaning. Learners move beyond description to interpretation, learning how to assess evidence, avoid common pitfalls, and translate insights into responsible, actionable conclusions.
By the end of this module, learners will be able to:
Data visualisation transforms rows of numbers into stories the eye can instantly grasp.
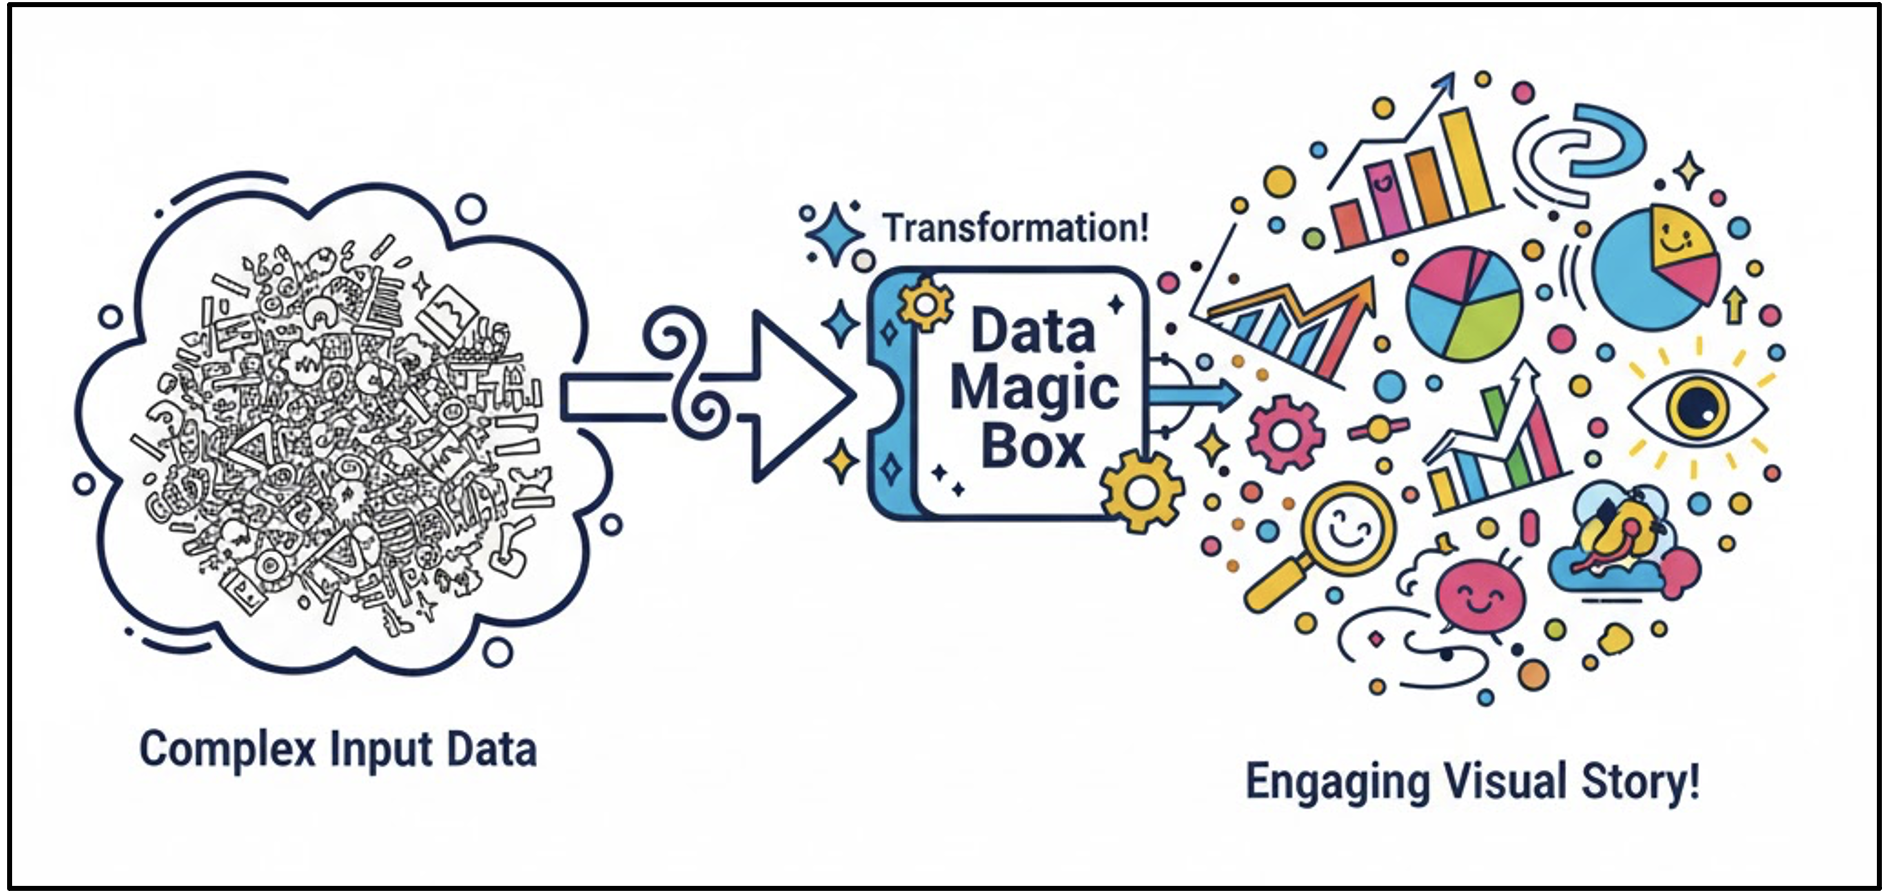
Patterns that hide in tables jump out in a chart.
💬 Think of a chart as a map — it helps you find direction in a sea of information.
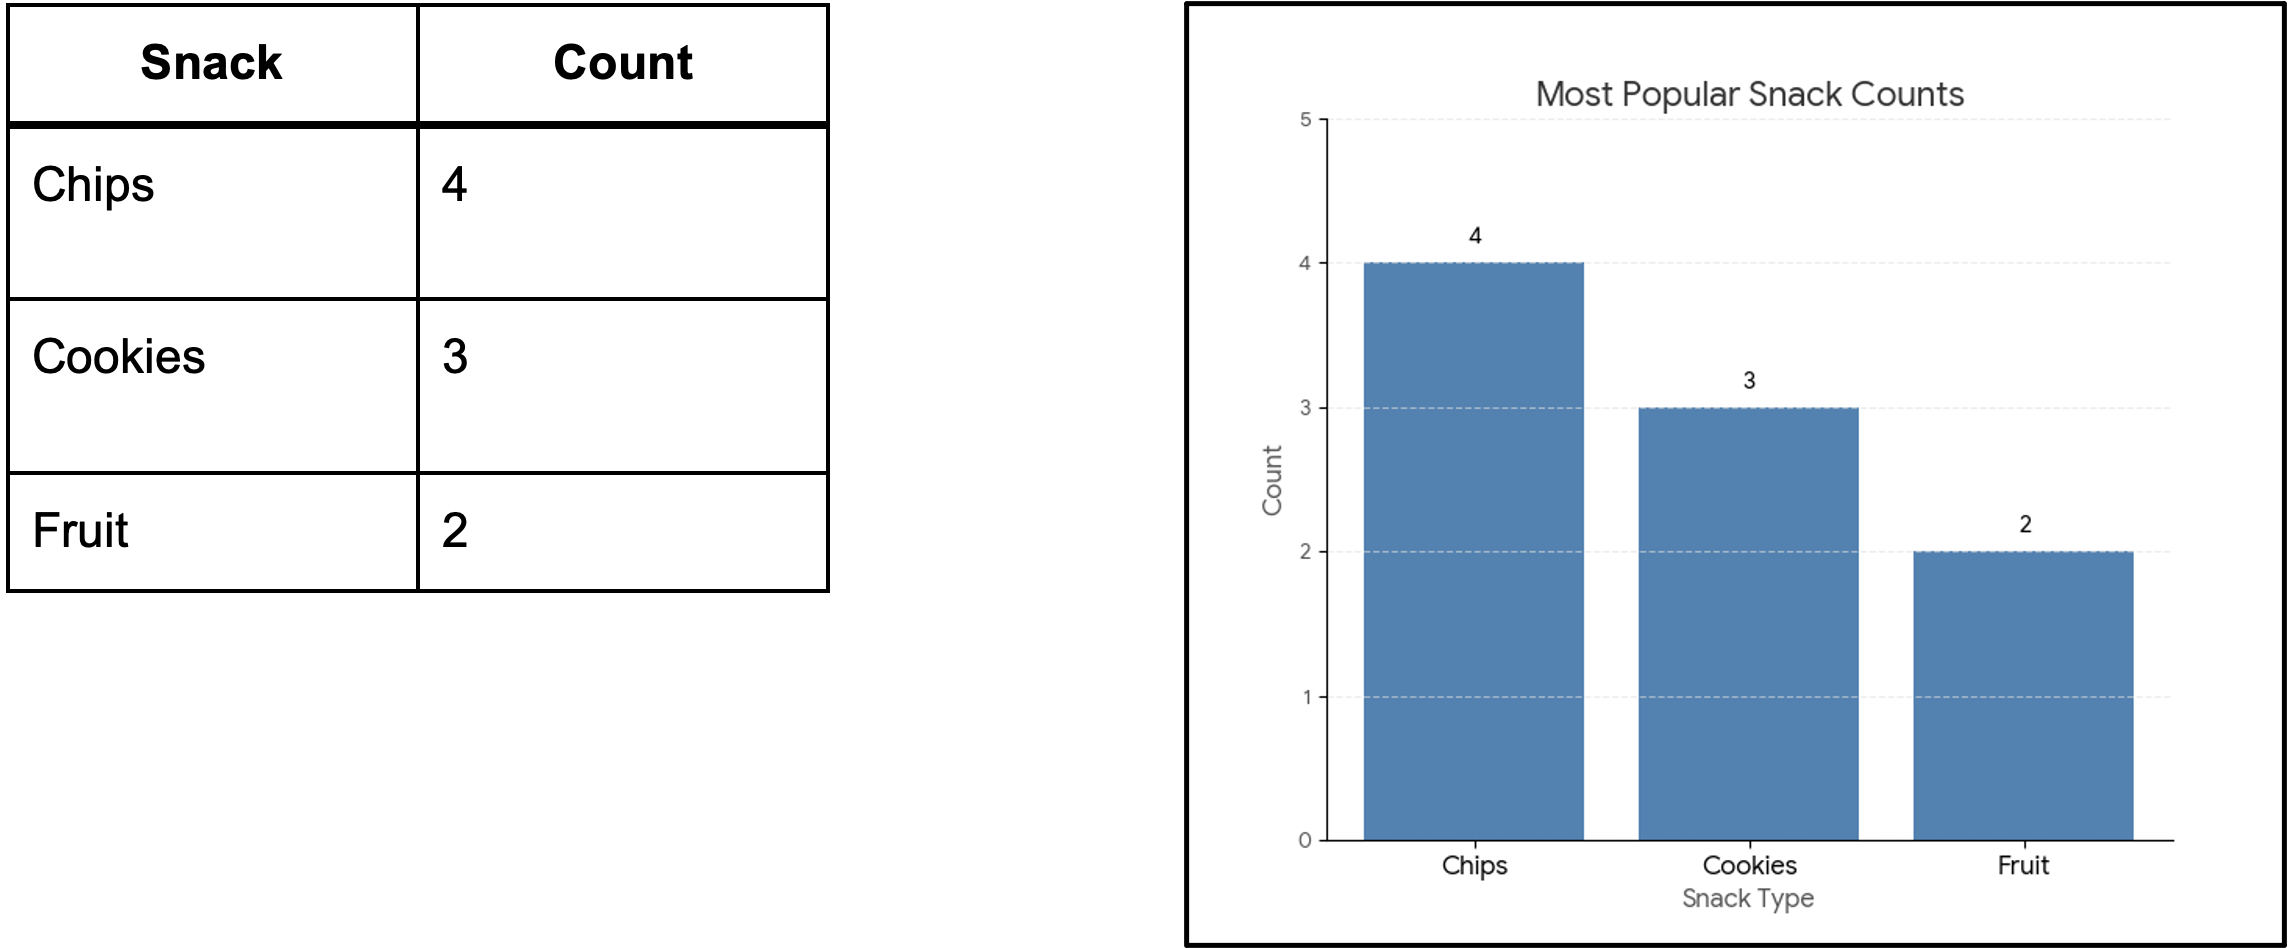
In a chart, you instantly see: Chips dominate. Cookies are next. Fruit lags behind.
🎨 The brain processes shapes faster than numbers.
When to Use: To see the distribution of a single category or track how one thing changes over time. Key Concept: Univariate Analysis - The story of a single column of data.
| Chart Type | What It Shows Best | Why It Matters |
|---|---|---|
| Bar Chart | Comparison between distinct categories | Instantly ranks items and shows magnitudes (e.g., favourite snacks by frequency). |
| Histogram | Distribution of continuous numerical data | Reveals the shape of the data: whether it is tightly clustered or widely spread (e.g., study hours per week). |
| Line Chart | Change over time (trends) | Shows continuity and rate of change across time (e.g., steps walked each day); the slope conveys the trend. |
📊 Bar charts can be vertical (like a cityscape) or horizontal
When to Use: When you need to show proportions where all parts add up to 100%. Key Concept: Compositional Analysis (The makeup of the total pie).
Pie Chart
Stacked Bar Chart - What It Shows Best: Composition that changes over a second category. - Showing Snack Preference Share by Campus Year (e.g., How the proportion of Chip eaters changes from Freshman to Senior year). - It allows comparison of the total length of the bars and the relative size of the segments within each bar.
⚠️ Keep it simple! Avoid more than 5 slices or they become confusing and impossible to compare accurately.
When to Use: To see if two numerical factors influence each other. Key Concept: Bivariate Analysis (The relationship between two columns).
Scatter Plot
Bubble Chart
🌱 Bivariate Analysis is the foundation to Discovering Links, Trends, and Outliers
When to Use: When the main point is not the average, but the variability, uncertainty, and range of data across different groups.
Key Concept: Comparing the internal stories of multiple categories.
📊 Visuals turn raw responses into visible stories.
N.b. this is only active during lessions.
Live lesson component
Questions and live results are available during the taught session.
Design isn’t decoration — it’s communication.
Ask:
🔹 Different visuals don’t just change how data looks — they change how data feels.
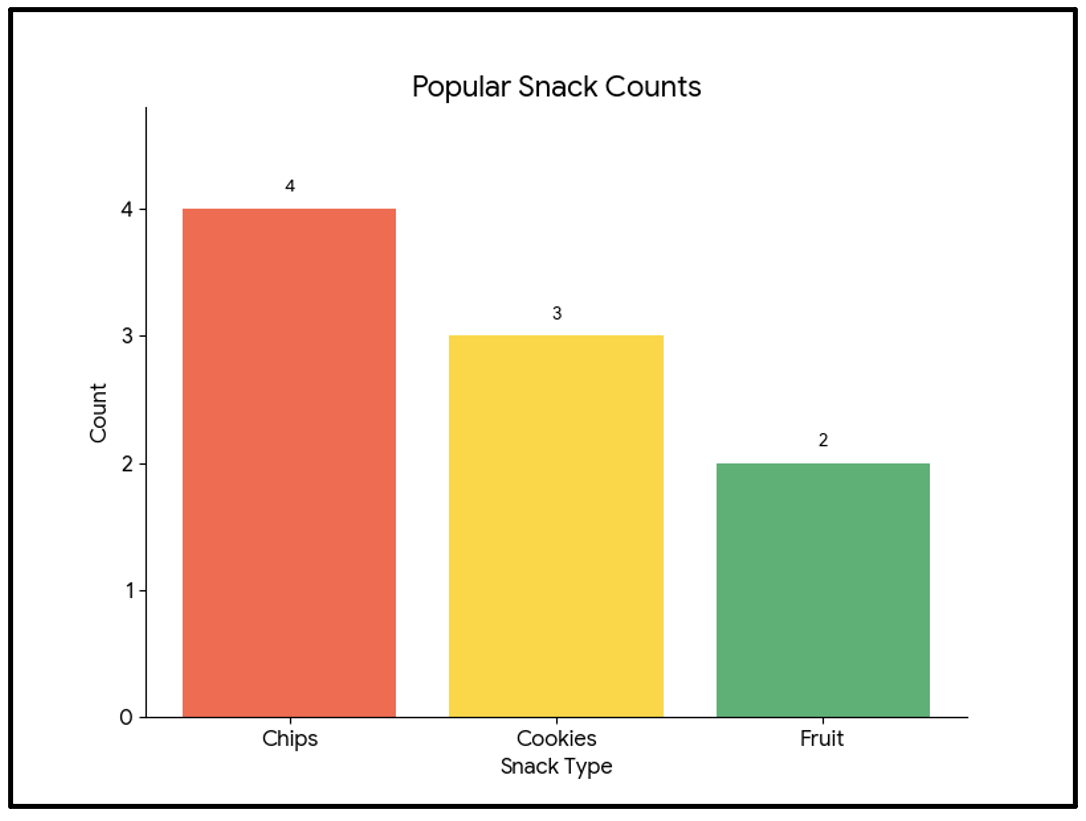
Can you point out the issues? - Small fonts - Eye-catching but cluttered
Possible improvements: - Clear fonts - Minimal or optimal usage of colours
A visual can reveal patterns — or hide them.
Good visuals show the truth clearly.
⚠️ Poor visuals manipulate perception
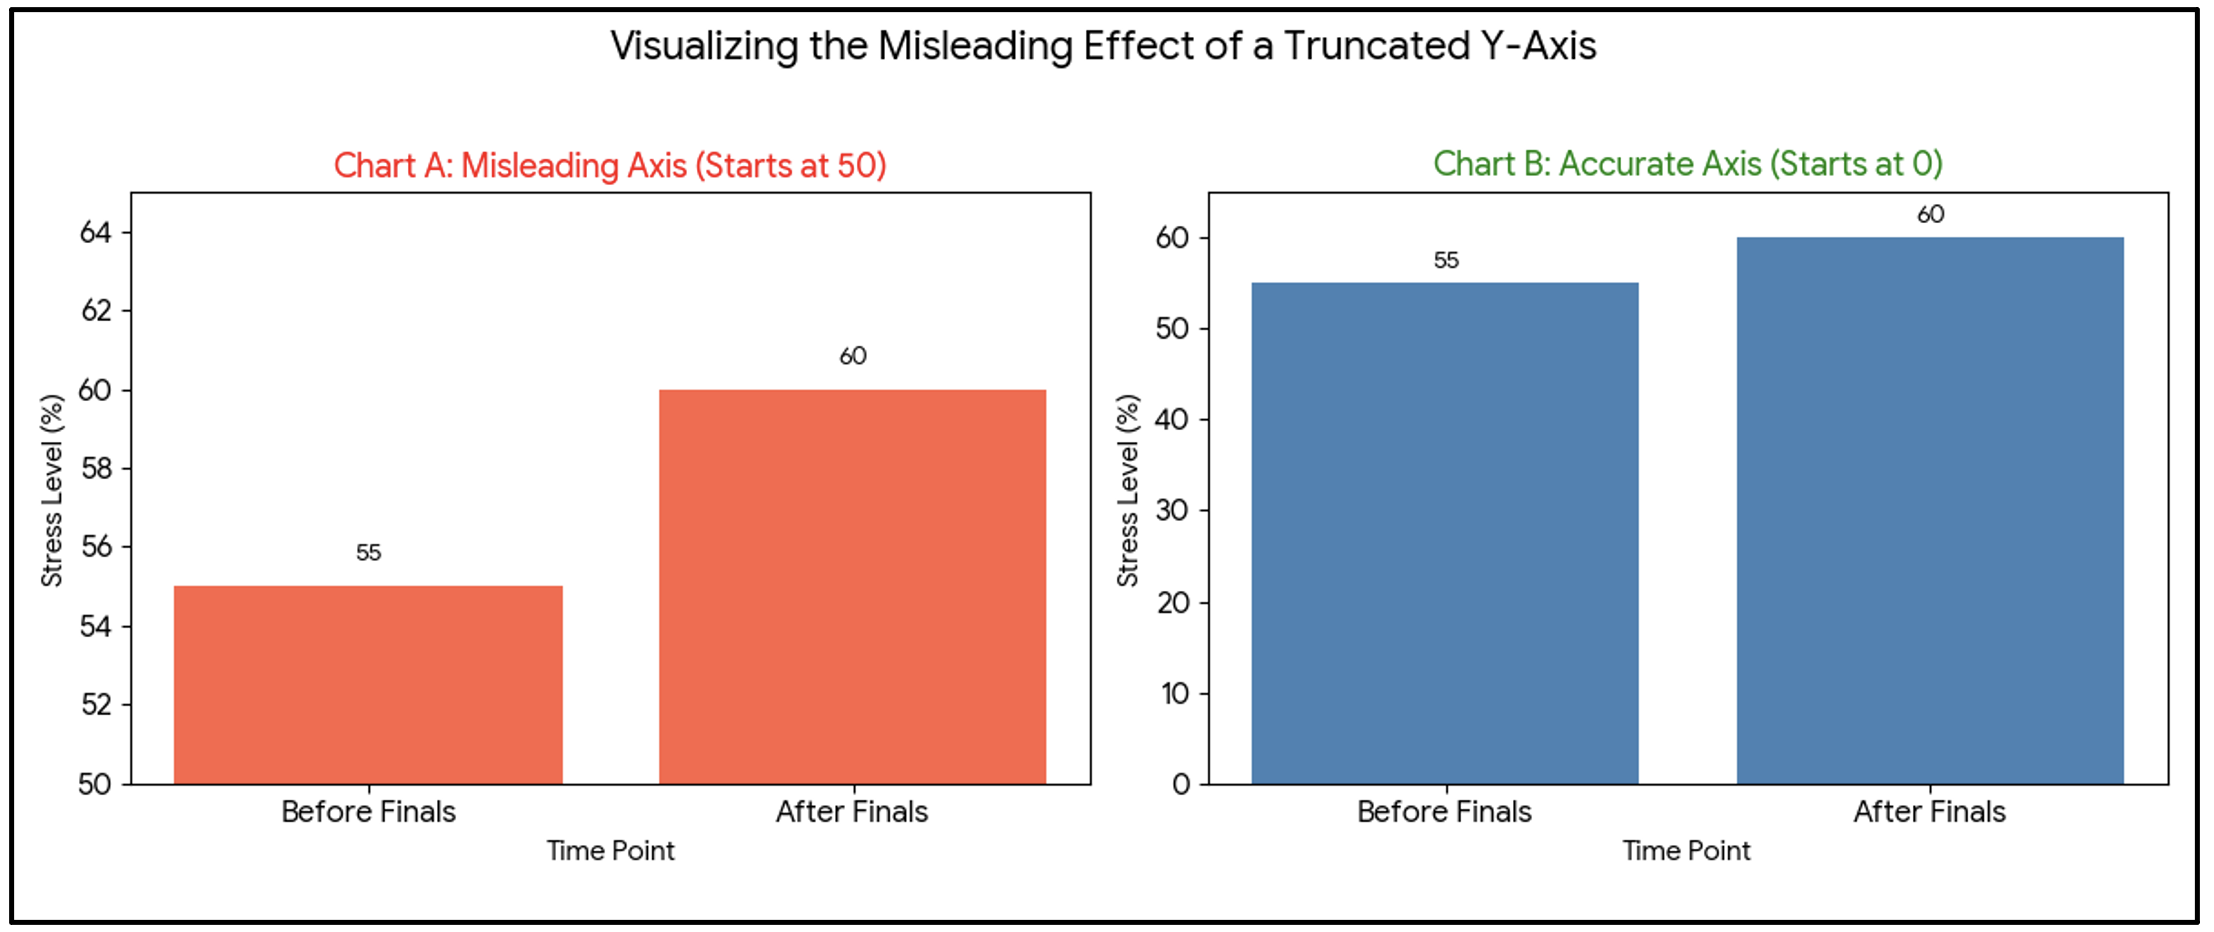
⚙️ Same data, different impression.
| Issue | Example | Why It’s Misleading |
|---|---|---|
| Truncated Axis | Starts at 50, not 0 | Makes small differences look big |
| Too Many Colours | 10 hues for 3 categories | Confuses the reader |
| Wrong Chart Type | Pie chart for time series | Hard to read progression |
| Missing Labels | Unclear categories | Data loses meaning |
💡 Visuals are powerful — and with that power comes the responsibility to design them honestly.
When interpreting a visual:
🧠 Learning to “read” visuals helps prevent misinformation.
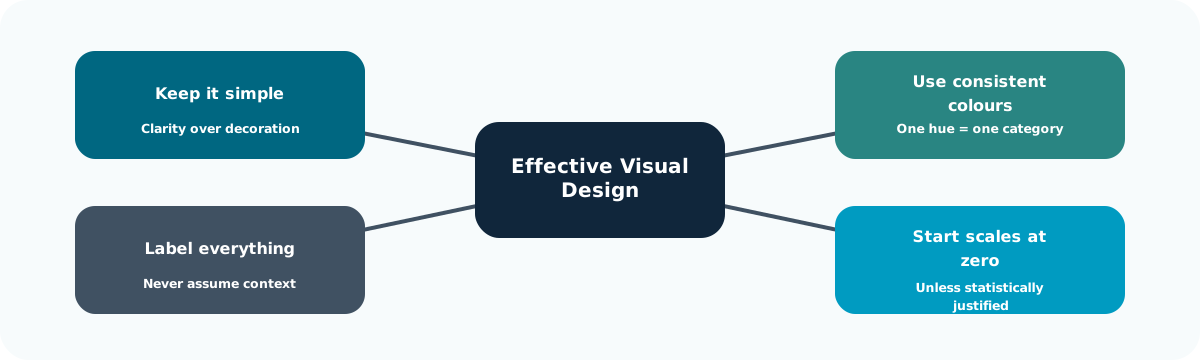
🧠 Good visuals reduce interpretation effort without hiding uncertainty or context.
Get into small groups (4-5 people).
Each Group takes one set of Data Cards and one set of Chart Cards, along with the provided paper and pen.
Match each Data Card to the Chart Card that best tells its story. (use the principles just discussed)
Find the most effective matches.
A case study in data interpretation for an App Platform Owner. if you are given a fact like: 60% of users quit! Without context, this sounds alarming.
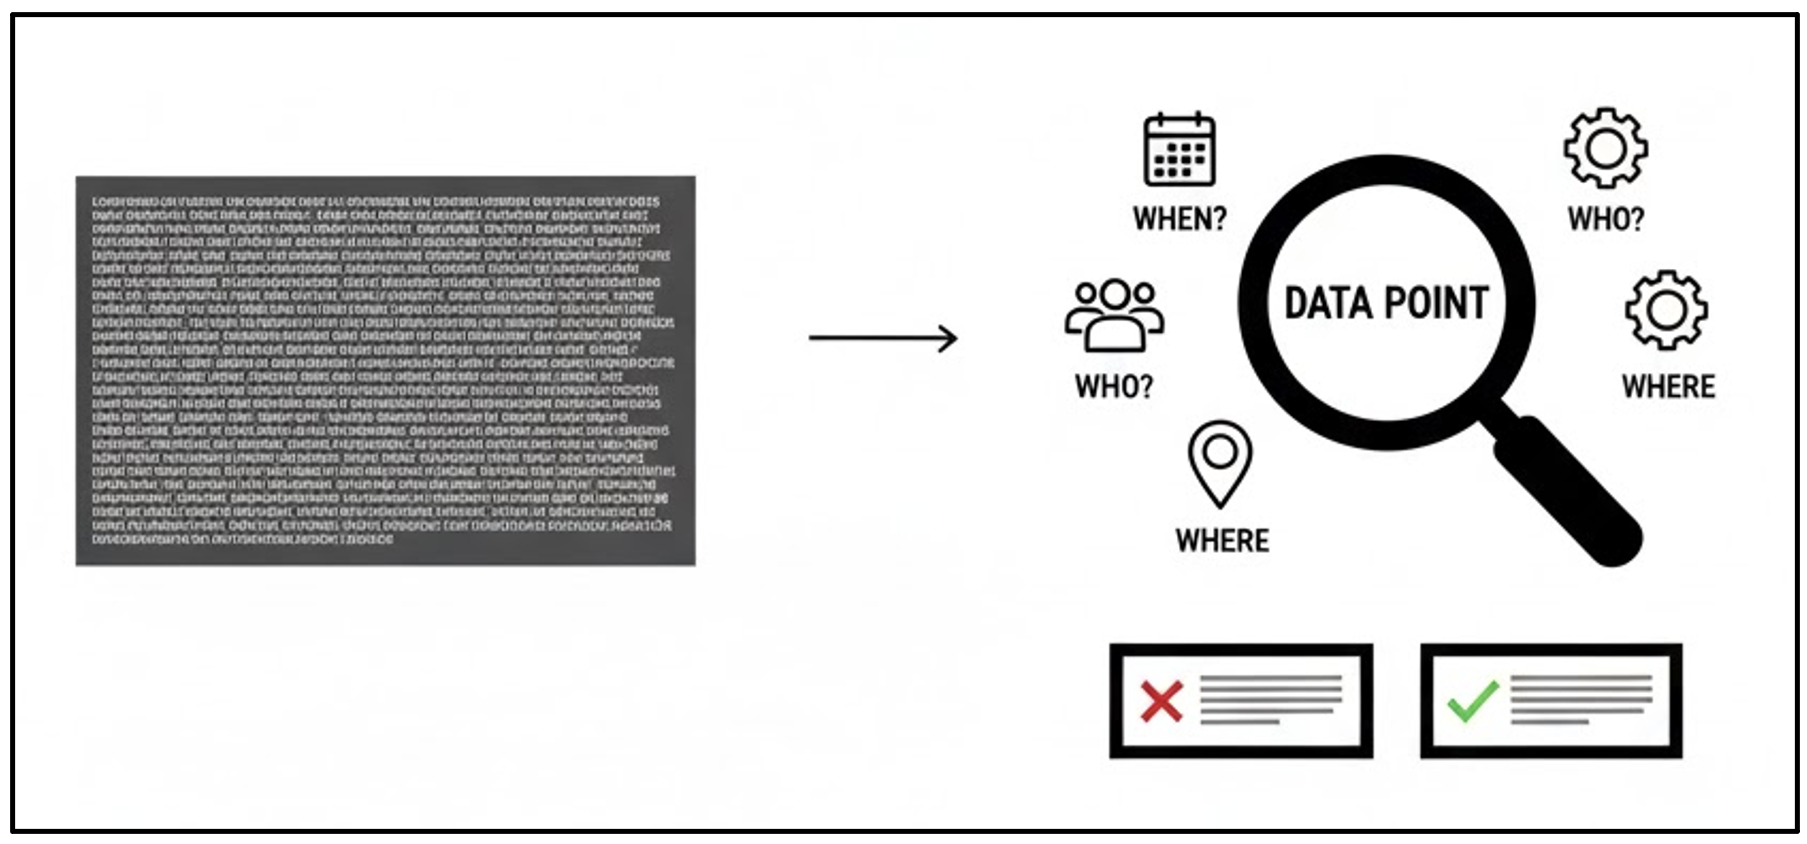
⭐ Numbers tell what. Context tells why.
| Stage | Context Revealed | Why It Matters | Interpretation Shift |
|---|---|---|---|
| “The Where” | Only from one specific app | Limits the scope: the problem is confined to a single product, not the entire platform. | It is a product issue, not a business failure. |
| “The When” | Only tracked in 2021 | Outdated data: the issue may no longer be present or may have been resolved. | It is a historical bug, not a current crisis. |
| “The Why” | Occurred immediately after an update | The causal link: the core app is sound; the issue arises from a newly introduced feature or bug. | It was a deployment mistake, not a fundamental design error. |
Different story entirely!
Never anchor a decision on a number until you know the full story.
🧩 Each layer of context reshapes meaning.
Once we have identified what our problem is, we move onto defining the other details.
| Element | Description | Example | Why It Matters |
|---|---|---|---|
| Who | Population or sample | University students | Limits the scope—ensures findings are not inappropriately generalised. |
| When | Time frame | Before vs. after policy change | Establishes a baseline and indicates whether an event caused a shift. |
| Where | Geographic scope | Campus A vs. Campus B | Controls for environment—shows whether findings are universal or location-specific. |
| How | Method of data collection | Tracking data | Assesses bias—determines whether the collection method influenced the results. |
| Why | Research question or purpose | Measuring student well-being vs. university performance | Anchors interpretation—ensures conclusions align with the original intent. |
💬 Data without context is like a quote without the full paragraph.
Before you conclude, always ask:
🧭 Context keeps interpretation grounded.
We have the scores of 2 student groups that participated in Football competitions across the UK in 2025. Team A and Team B both averaged 8 points.
The raw data that makes up the average:
Team A’s Scores: 8, 8, 8, 8, 8 Team B’s Scores: 1, 15, 8, 10, 6
Team A is consistent (low risk). Team B is volatile (high risk/high reward).
The external factors that explain the numbers:
Team A: Always competed against junior-level competition. Team B: Scores were achieved competing against senior-level champions in two of five matches.
Team A looks inflated by easy wins. Team B’s average of 8 is far more impressive given the competition.
Data is only useful when it drives decisions.
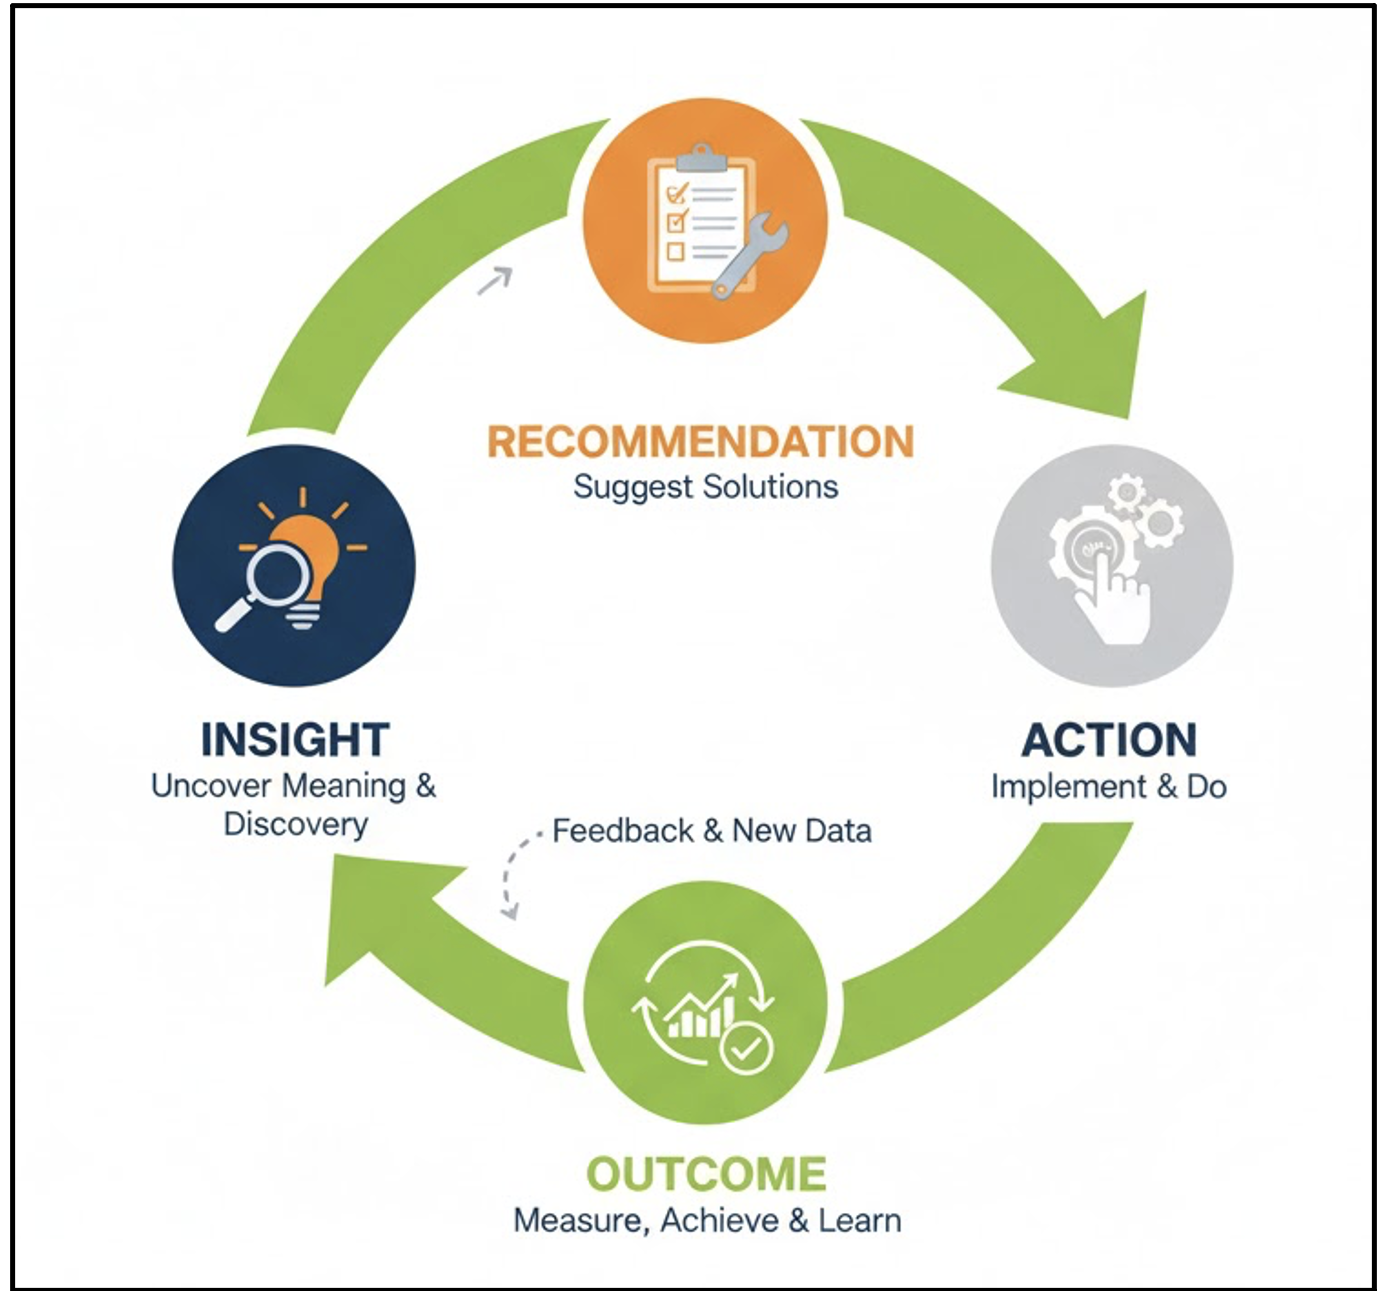
This is a cycle of continuous improvement!
🔁 Turning numbers into action closes the data loop.
Good insights are:
Example:
If survey shows students feel unproductive in mornings, Action: Schedule workshops later in the day.
🤝 Actionable insights are the bridge between understanding a pattern and making an organizational change.
How you present results affects whether they are used.
📦 Use data to move from Observation → Decision → Measurable Outcome.
Not all actions are equal. Ask:
🔍 Data drives better questions, not just answers.
Responsibility matters:
🎯 Data should illuminate, not manipulate.
This activity helps learners bridge the gap between analysis and business strategy. Setup: Divide the learners into small groups (4-5 people).
Scenario 1: “Survey shows 65% of students feel unproductive in mornings.” Scenario 2: “End-of-semester course reviews show that 80% of students who received a grade of ‘C’ or lower did not attend the optional weekly tutorial session.”
Each group’s goal is to quickly agree on one specific, actionable recommendation the university should implement based on this data.
Formalise their action plan for each scenario. Frame your recommendation as:
Present your action plans!
🔹 Overall Message: Making sense of data isn’t just analysis — it’s interpretation, communication, and action.
📚 Try turning your M6 analysis into visuals — see how patterns come alive.
This module develops the skills required to move from raw data to meaningful interpretation and informed action. Learners examine how visualisation reveals patterns that are difficult to detect in tables, how design choices influence interpretation, and how misleading visuals can distort conclusions.
Emphasis is placed on reading charts critically, recognising common pitfalls, and applying clear design principles. The module then demonstrates how context (who, when, where, how, and why) fundamentally reshapes the meaning of data, preventing overgeneralisation and false inference.
The concepts in this module connect directly to practical data handling and exploration in Python.
| Submodule | Python Connection | Why It Matters |
|---|---|---|
| Visualisations for Insights | Create bar, line, scatter, and pie charts using matplotlib or seaborn | Demonstrates how to transform numerical summaries into clear visuals. |
| Making Sense of Visuals | Use plt.xlabel(), plt.title(), plt.ylim() to refine visuals |
Builds good design practice and improves interpretability. |
| Context is Key | Merge datasets (pd.merge) and apply filters to limit scope |
Reinforces that insight depends on appropriate context. |
| Insight to Action | Create summary reports or dashboards; link visuals to decisions | Prepares learners to communicate results clearly and responsibly. |
📚 You can apply the same activities directly in Python to reinforce these concepts.