Organising and exploring data is a critical step between data collection and meaningful analysis.
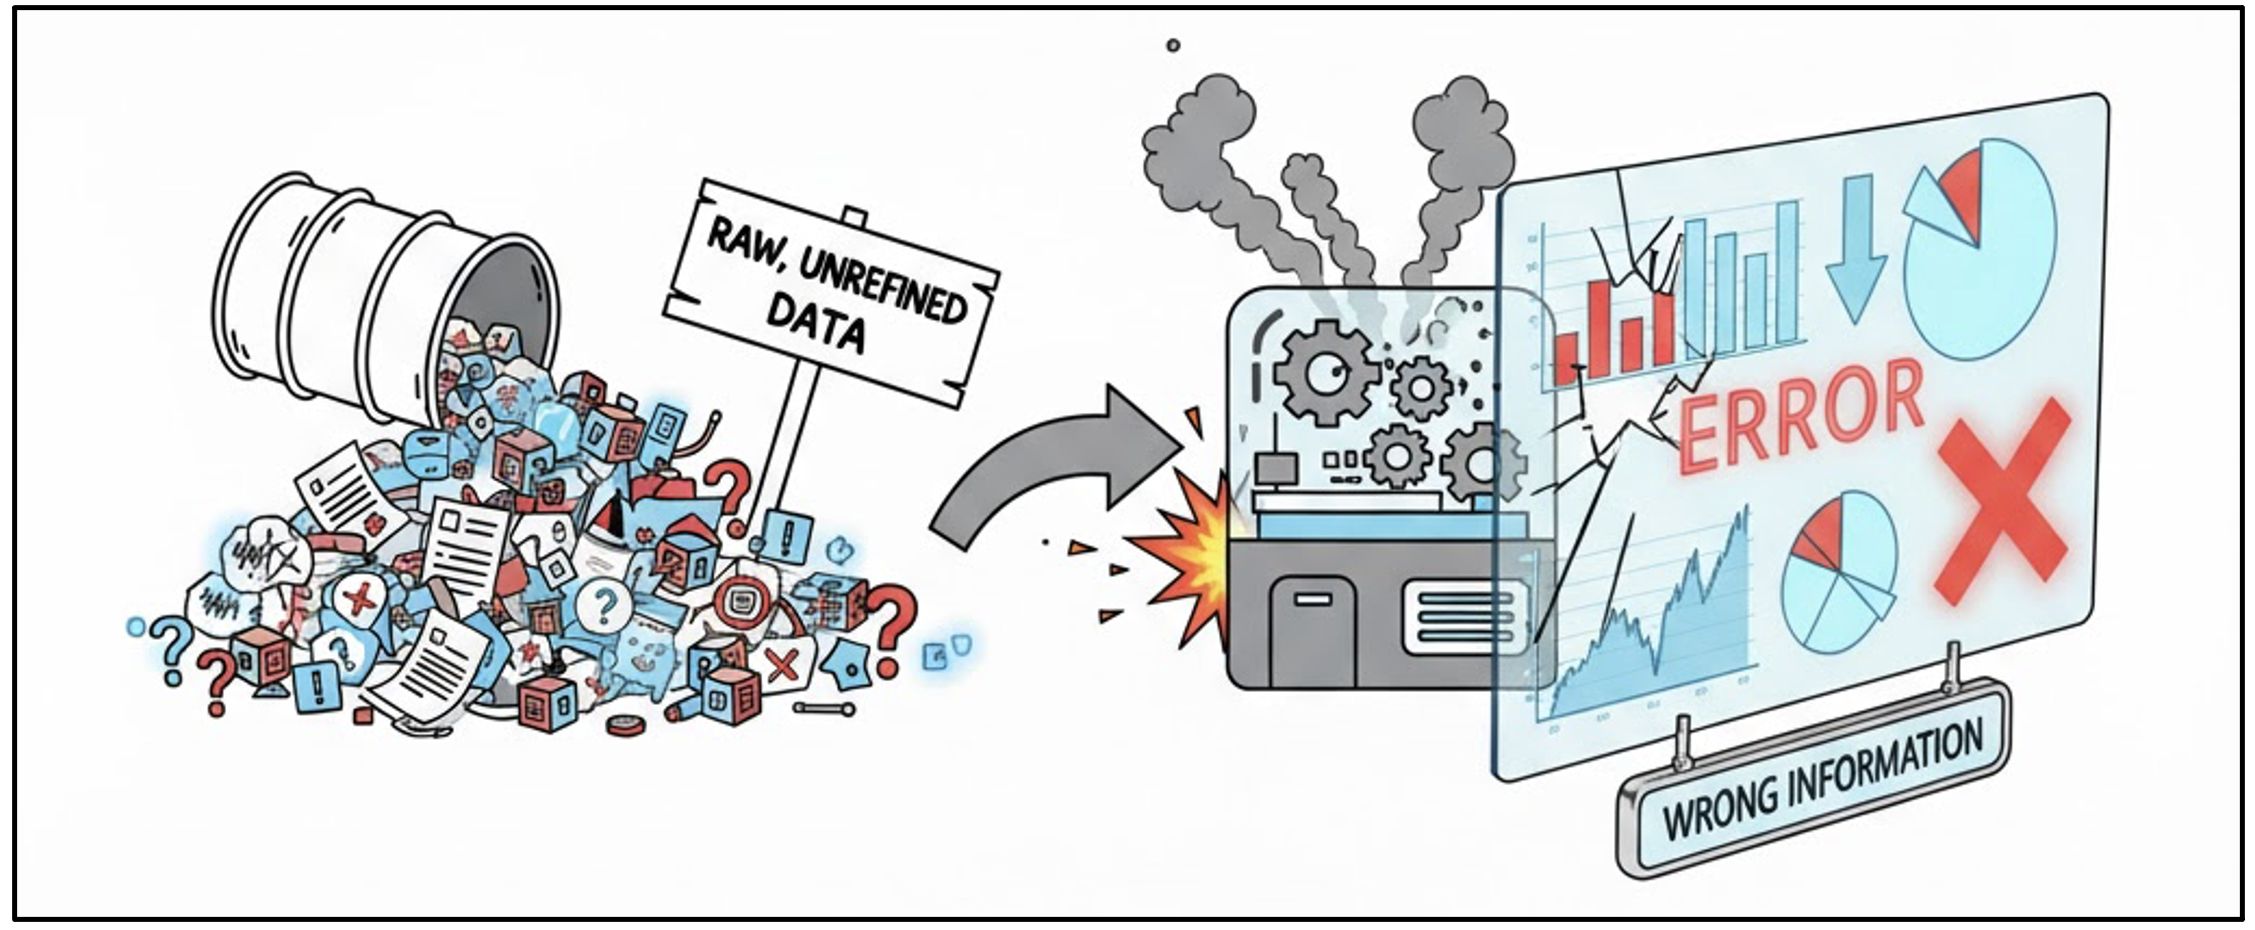
Raw datasets are rarely ready for use; they often contain errors, inconsistencies, and gaps that must be addressed before reliable insights can be drawn.
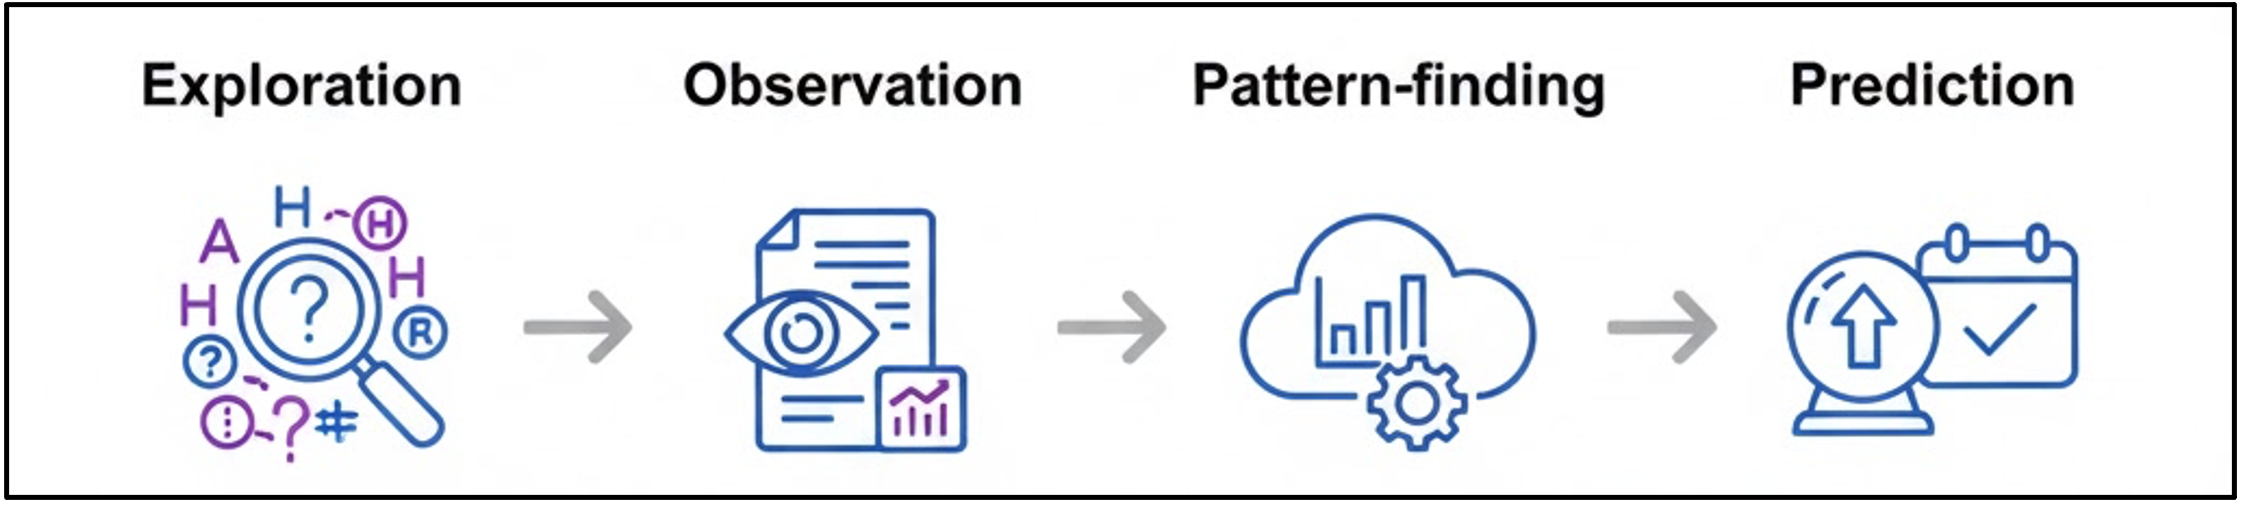
This module focuses on preparing data for analysis and using exploratory techniques to understand structure, patterns, and relationships, supporting the transition from description to interpretation and early prediction.
By the end of this module, you will be able to:
Organising Messy Data (~20 min)
Identifying and correcting inconsistencies, duplicates, and missing values.
Exploring Data (~20 min)
Using basic descriptive and comparative techniques to summarise information.
Finding Patterns (~20 min)
Moving from exploration to interpretation by spotting trends and building hypotheses.
Predicting Outcomes (~20 min)
Using hypotheses to anticipate possible outcomes and introduce early predictive thinking.
Data rarely arrives clean. Messy data is any dataset that violates the rules required for analysis.
💬 Messy data is any data that violates the rules needed for easy analysis. It may contain missing values, inconsistent labels, extra spaces, or mixed types.
| Name | Age | Snack | Height | Home Country |
|---|---|---|---|---|
| Sarah | 21 | Chips | 1.63 m | UK |
| sarah | 21 | crisps | 1.63 | United Kingdom |
| NA | Cookies | 1.7 | UK |
🕵️ Think of this stage as being a data detective — scanning the scene, not solving the case yet.
| Problem | Example | Impact on Analysis |
|---|---|---|
| Inconsistent Entries | Sarah vs. sarah | Impossible to count unique names |
| Mixed Types/Formats | 1.63m vs 163 vs 5’4” | Blocks averages |
| Missing Values | NA or blanks | Misleading averages and errors |
| Synonyms/Variations | Chips vs. crisps | Hides true popularity |
� ️ If data is inconsistent, your results can be misleading or invalid. Data analysis is built on trust.
If your data is inconsistent, your results can be misleading or invalid.
Organising data helps you:
🧩 Clean data = reliable analysis
Cleaning data often involves addressing four main categories of issues.
❌ Clean data isn’t perfect data; it’s data ready for reliable calculation.
Organising data includes properly identifying its type, as this determines what math you can perform.
| Type | Description | Examples | Operations Allowed |
|---|---|---|---|
| Categorical | Qualities, groups, names | Gender, Country, Snack | Counting, grouping |
| Numerical | Quantities that can be measured | Age, Steps, Commute | Mean, median, sum |
⚙️ You must convert mixed numerical data (like ‘22 yrs’) into pure numbers before you can calculate the mean age.
Downloaded dataset:
How can inconsistent categorisation hide data and skew average?
Exploring data is like being a detective getting your first look at a crime scene. You don’t jump to conclusions; you survey the scene to understand the layout, the context, and what’s missing. Exploration means getting to know your dataset before deep analysis.
It’s about asking foundational questions:
💡 Exploration helps you catch any cleaning mistakes you missed and prepares you to form smart questions.
| Technique | Tells You | Example Question |
|---|---|---|
| Mean | Typical value | Average height? |
| Median | Middle value | Median commute time? |
| Mode | Most frequent | Most common snack? |
| Min/Max | Range | Youngest and oldest? |
📈 These techniques are impossible to calculate reliably until your data is clean.
Descriptive statistics are best understood when visualized. A distribution shows how often each value appears.
⭐ A simple bar chart of the Campus Transport Method instantly shows you the mode and the distribution of travel options.
While the mean is often used, the median is crucial when your data might have outliers.
| Statistic | Meaning | Best Use Case |
|---|---|---|
| Mean | Sum of all values / Count of values | Best for symmetrically distributed data (e.g., Height). |
| Median | The value exactly in the middle of a sorted list. | Best for skewed data (e.g., Income or Commute Time, where a few long commutes skew the average). |
💬 The median gives you a more reliable picture of the “typical” student experience.
Download the cleaned dataset
⬇ Download cleaned student dataset
For each of the above, what is the test you used?
After basic exploration, we move from simple facts (“The average age is 21”) to asking why these facts exist.
The power of data lies in spotting patterns—trends, clusters, or relationships that tell us something new.
💡 Patterns show correlations, not necessarily causation—that’s key.
We look for patterns by combining variables, shifting analysis from a single column to the relationship between two or more.
| Technique | Example | Shows |
|---|---|---|
| Frequency counts | Most common snack | Popularity |
| Group comparison | Average age by snack type | Demographic patterns |
| Cross-tabulation | Snack by home country | Relationships |
| Sorting/filtering | Top 3 snacks | Quick insights |
Patterns help you:
� Example: “If taller people walk more, maybe height relates to physical activity.”
Patterns help us form hypotheses, guesses about the way the world works, that advanced analysis can test.
Example table:
| Snack | Avg Age | Avg Steps |
|---|---|---|
| Crisps | 20.1 | 4,000 |
| Cookies | 21.3 | 5,500 |
| Fruit | 23.2 | 7,000 |
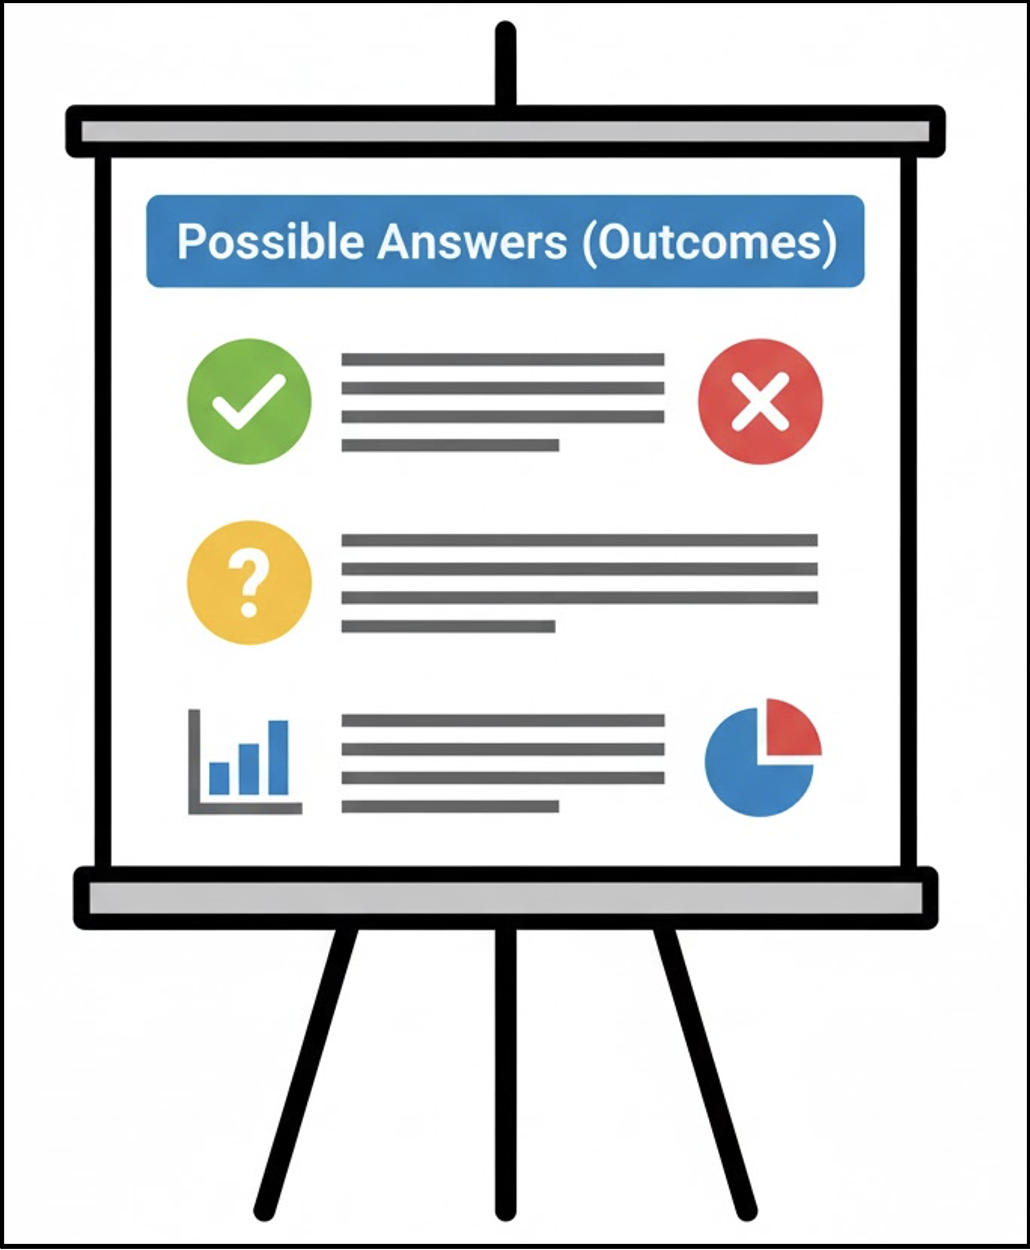
What could this suggest? Hypotheses are testable guesses — they bridge what we see and what we want to know.
Using the cleaned dataset:
⬇ Download cleaned student dataset
Which patterns might be meaningful and which might just be random.
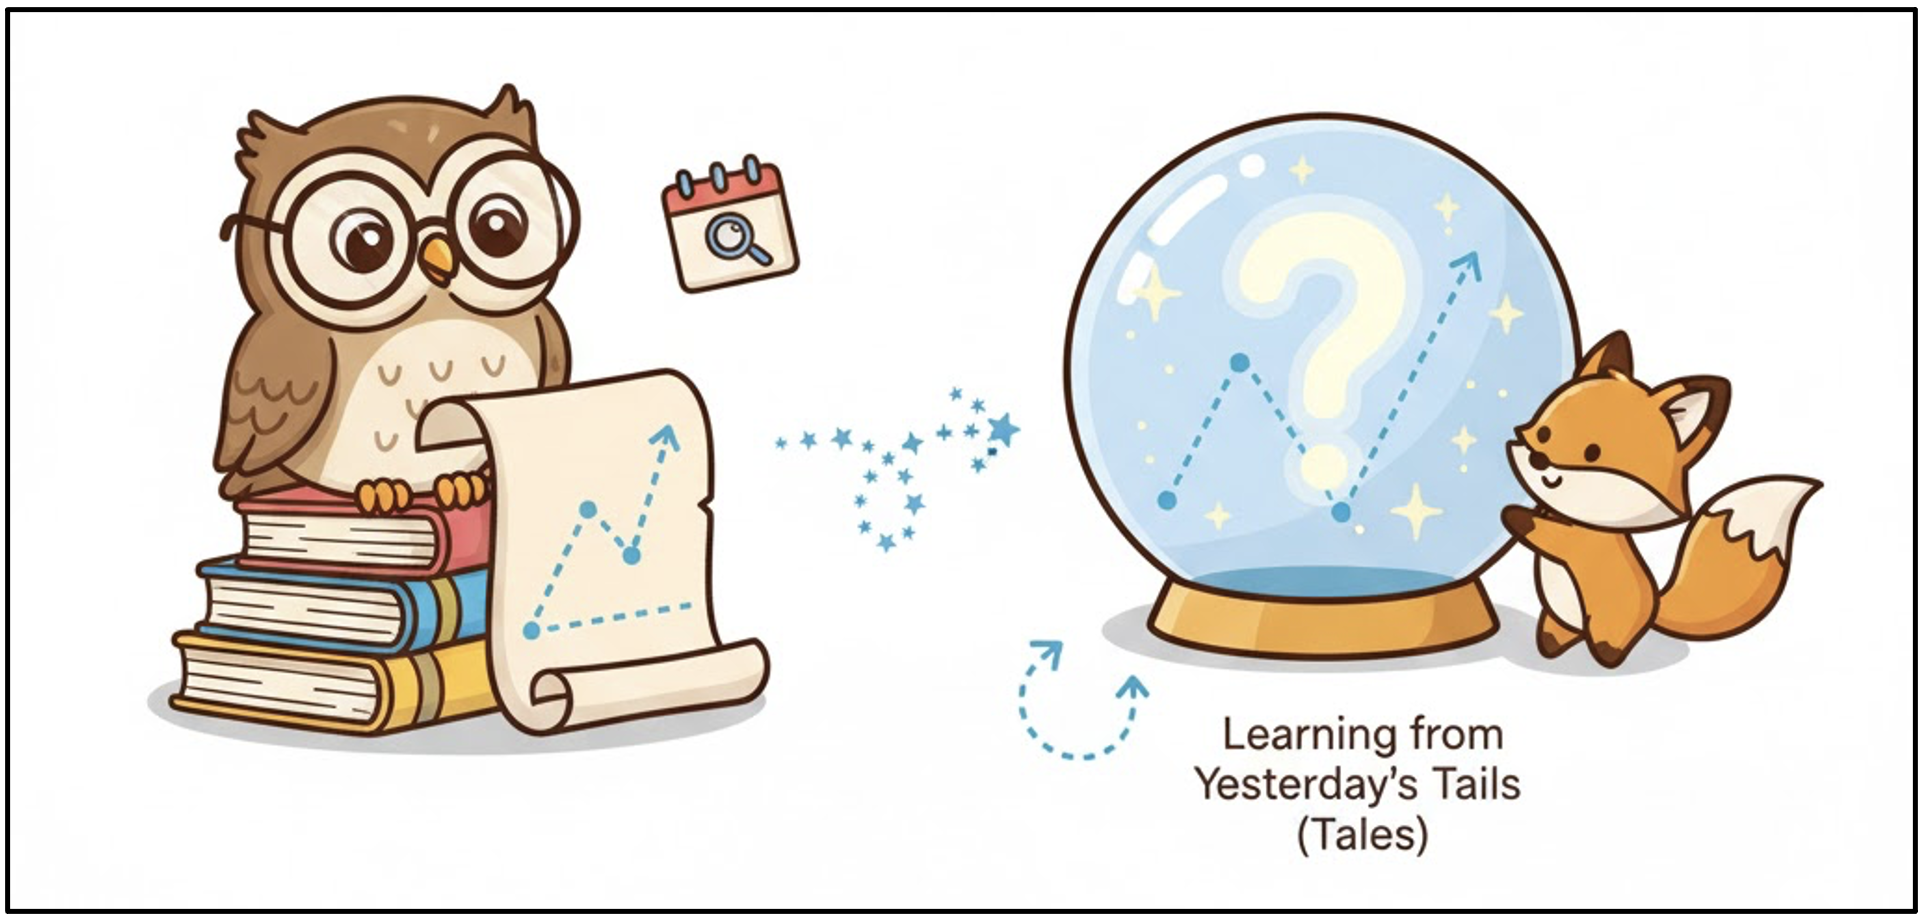
Prediction = using what you know to estimate something unknown.
Even simple predictions rely on recognising past patterns.
� Predictions are based on the idea that similar situations will likely lead to similar results.
We can use the hypotheses from our insights to predict what could happen next!
Prediction is not just to describe what we’ve seen, but to anticipate what might come next based on what we’ve learned.
💯 Prediction is simply history with a deadline.
Flow:
Example:
🤓 The discovery of the planet Neptune in 1846 was a pure prediction! Astronomers didn’t actually see it first, they used the laws of physics and mathematics to predict the exact location and mass of an unseen planet whose gravitational pull was causing the disturbance.
Steps:
Example:
“If taller people walked more steps in our dataset, we might predict that a tall newcomer would too.”
💬 Prediction is informed guessing — powered by data.
| Approach | Example | Concept |
|---|---|---|
| Rule-based | Age > 20 → savoury | Heuristics, pattern-making |
| Trend extrapolation | Snack preference over time | Trend extension |
| Probabilistic | 60% chance chips | Predictive likelihood |
📌 Every time you check the weather, you’re relying on a data model making a prediction.
Prediction � certainty.
Predictions guide decision-making but should always include uncertainty.
🎯 The goal: be less wrong.
This activity forces groups to move beyond pattern recognition to hypothesis-driven prediction.
Using the cleaned dataset:
⬇ Download cleaned student dataset
Divide the class into groups (5-6 people each) Groups will act as data scientists to predict a new, unmeasured variable: Estimated Daily Energy Level (High or Low) for all students which is currently hidden from the dataset.
Each group must complete the following four steps and record them:
| Element | Group Presentation Task |
|---|---|
| Hypothesis | Correlation of Sleep and Activity with Estimated Energy |
| Variables & Criteria | Low Energy if Hours Slept > 10.0 |
| Prediction | 50% |
Before analysis or coding, take time to understand your dataset. Exploring and organising data is like learning a new language—you cannot interpret meaning without first understanding structure and context.
This module focuses on the data workflow that bridges collection and analysis. It emphasises cleaning and organising raw data, exploring structure and relationships, identifying meaningful patterns, and using these insights to form hypotheses and early predictions. The aim is to ensure that subsequent analysis is informed, robust, and appropriately cautious.
The concepts in this module connect directly to practical data handling and exploration in Python.
| Submodule | Python Connection | Why It Matters |
|---|---|---|
| Organising Messy Data | Clean and tidy data using pandas (remove duplicates, handle missing values, standardise formats). |
Establishes a reliable foundation for all data projects. |
| Exploring Data | Use .info(), .describe(), and .value_counts() to summarise datasets. |
Supports rapid understanding and preliminary insights. |
| Finding Patterns | Apply grouping and filtering (groupby, pivot_table) and introduce clustering. |
Transforms summaries into meaningful insights; links to later methods. |
| Predicting Outcomes | Explore basic prediction using correlations or simple sklearn models. |
Introduces predictive thinking that connects to machine learning. |
📚 You can apply the same activities directly in Python to reinforce these concepts.