
Producing an insight is not the end of research, it is the beginning of the next decision. In applied data work, value is created not by analysis alone, but by how insights are translated into action, evaluated through feedback, and refined over time. Research therefore functions as an iterative process rather than a linear pipeline, where each action generates new data, constraints, and questions.
This module focuses on the transition from understanding to impact. Learners examine how insights differ from outcomes, how feedback should be treated as structured evidence rather than judgement, and how the same finding must be framed differently for different audiences without compromising accuracy. The emphasis is on building a mindset that treats research as adaptive, communicative, and accountable to real-world change.
By the end of this module, learners will be able to:
In traditional projects, you finish a task and move on.
In Research, you finish a task and find three new problems. This is a feature, not a bug!
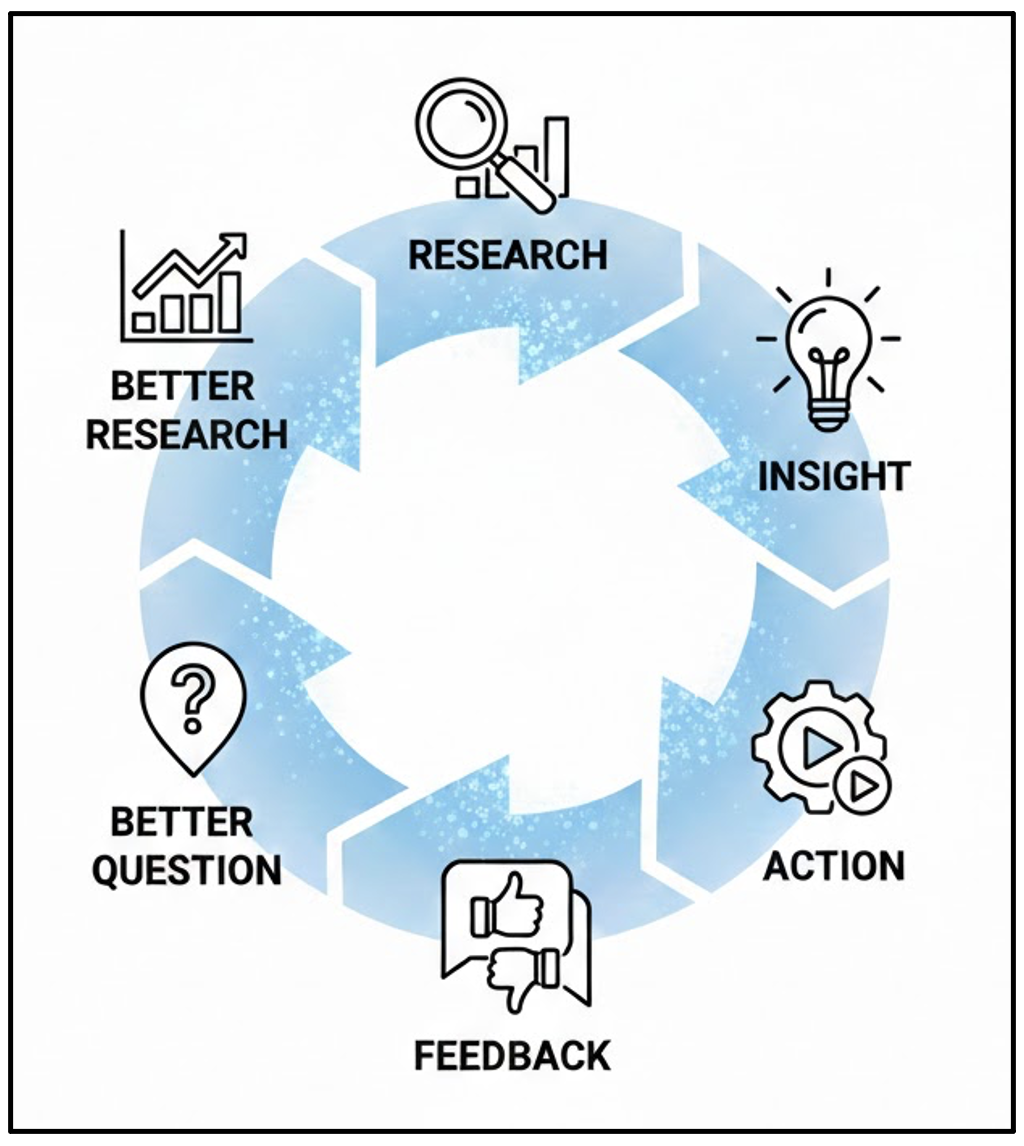
The Spiral of Innovation You aren’t just going in circles; you are moving “upward.” Each loop makes the project more refined.
The Action-to-Question Link: In research, “Action” often means building a prototype or testing a theory. The data you get back from that action becomes the starting point for your next question.
🌀 Insight is meaningful only when it connects back to the original question.
Every answer creates new uncertainty — and that’s a good thing.
Even success creates questions. In research, certainty is temporary.
In reality, the process is an iterative loop where actions lead to feedback and new questions, fueling a cycle of continuous improvement.
🔎 Think of research like building a prototype, not submitting homework. You’re never “finished”; you’re just at the next version.
| Stage | What Happens | Why It Matters |
|---|---|---|
| Question | What are we trying to understand? | Sets direction |
| Analysis | What does the data say? | Generates insight |
| Insight | What does it mean? | Adds interpretation |
| Action | What do we change or test? | Creates impact |
| Feedback | What worked / didn’t? | Fuels the next loop |
🎯 If your insight doesn’t loop back to your question, it’s just an observation — not an answer.
If you believe research ends at action:
If you understand research as a loop:
💯 This mindset is what separates analysis from innovation.
Let’s say:
If you stop here, you’re assuming:
But if you loop:
✅ Each answer generates a better next question.
Each student receives one action scenario.
Students pair up and:
Volunteers share:
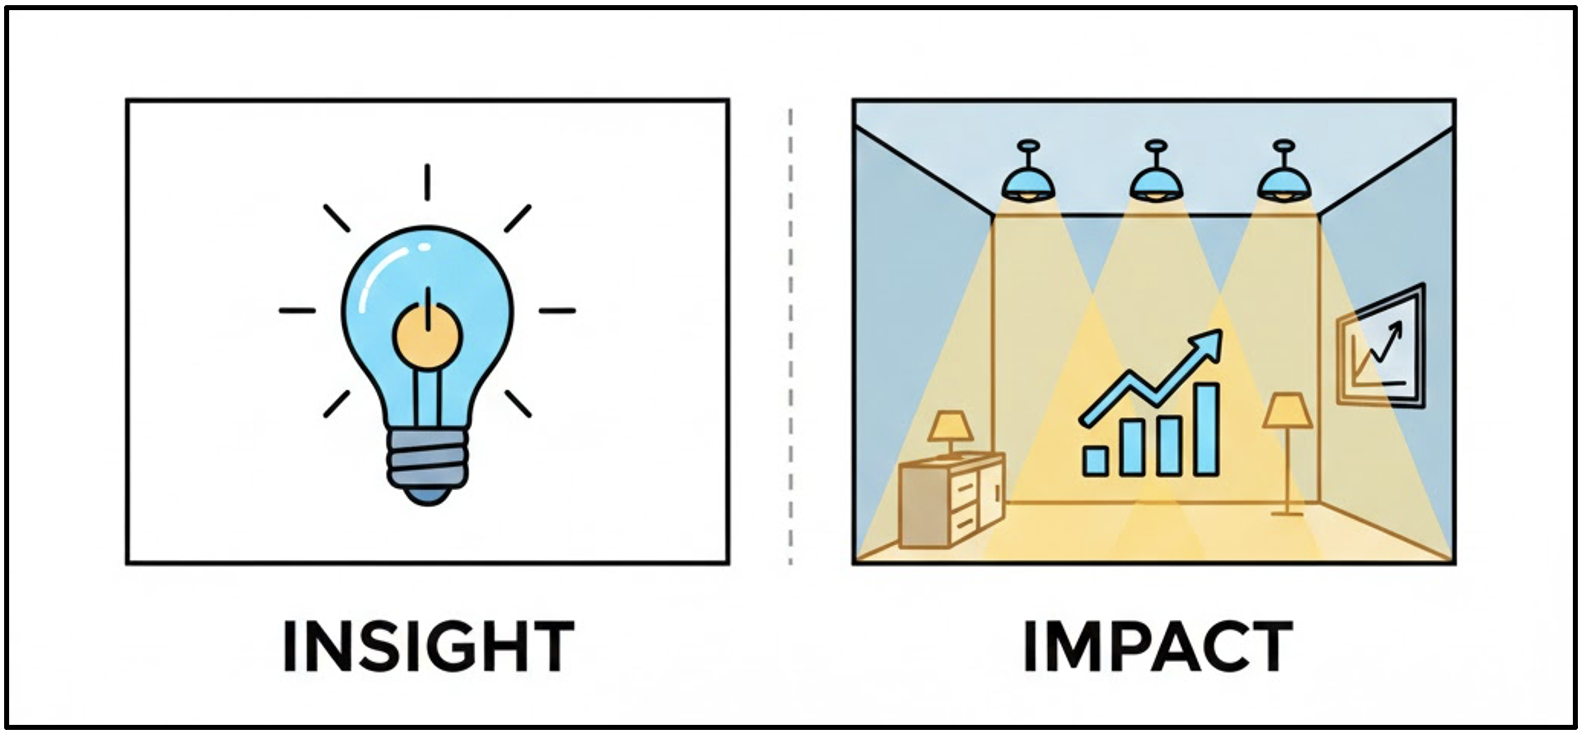
An insight is understanding.
Impact is change.
💡You can have a brilliant insight that changes absolutely nothing.
This is one of the most important distinctions in applied data work. An insight answers: “What does this data suggest?”
Impact answers: “So what actually changes because of this?”
You can have:
❗ Insight without action is like diagnosis without treatment.
| Concrete Comparison | Concrete Comparison | Concrete Comparison | Concrete Comparison |
|---|---|---|---|
| Concrete Comparison | Concrete Comparison | Concrete Comparison | Concrete Comparison |
| Concrete Comparison | Concrete Comparison | Concrete Comparison | Concrete Comparison |
| Concrete Comparison | Concrete Comparison | Concrete Comparison | Concrete Comparison |
| Concrete Comparison | Concrete Comparison | Concrete Comparison | Concrete Comparison |
🌱 Over 70% of data science projects in organisations fail to create impact — not because the analysis is wrong, but because no decision was ever attached to the insight.
| Action Type | Example | Impact Level |
|---|---|---|
| Symbolic | “Share findings in a report” | Low |
| Informational | “Present at a meeting” | Medium |
| Structural | “Change policy / run a pilot” | High |
� Impact usually involves cost, effort, or risk — which is why it’s harder.
Get into small groups (4–5 people).
Each group gets one insight.
Each student writes:
Group consolidates answers into: Action | Impact Level | Why
In earlier modules, we talked about collecting data through:
🔄 Feedback is different. Feedback is data created by your action interacting with reality.
Many people hear feedback as:
In research, feedback helps you in the following ways:
📝 Unlike surveys or historical data, feedback comes from real-world interaction with your solution.
A blindspot is feedback that reveals a factor you didn’t account for at all.
Blindspot feedback is useful because it:
🧐 Most failed products didn’t fail because the insight was wrong — they failed because the team never listened to early feedback signals.
Analysis Insight: Exam performance is bad as students aren’t attending optional tutorials.
Action: We want to make all tutorials mandatory to improve performance.
Feedback: “This is too expensive.”
� ️ The most dangerous thing is no feedback — not negative feedback.
This feedback is not saying:
It’s saying:
💬 The insight may still be correct — the action needs refinement.
A constraint is feedback that highlights a practical limit on execution. Constraints:
💎 Each constraint refines the solution without discarding the insight.
Analysis Insight: Student engagement data shows that freshmen feel “lost in the crowd,” leading to a spike in course withdrawals.
Action: Let’s introduce weekly one-to-one mentoring. Feedback: “We don’t have staff for this.”
📕 In large organisations, staffing constraints are the #1 reason insights don’t turn into action — even when leadership agrees with the findings.
This feedback is not rejecting the idea.
It’s saying:
⚙️ Constraints force realism.
An extension is feedback that suggests additional applications of your work. Extensions:
Analysis Insight: First-year students are struggling to bridge the gap between theoretical lectures and practical application due to static tutorial structures.
Action: We redesigned tutorials for first-year students.
Feedback: “Could this apply to postgraduate courses too?”
📖 Many high-impact policies and platforms started as “extensions” — someone simply asked, “Could this work somewhere else too?”
Extensions signal:
🚀 Extensions are often the earliest signs of high-impact research.
Each student writes:
“Students are least productive in the morning.” Action must be specific.
Discuss 5–6 actions aloud. Class responds only with:
No explanation needed.
A common mistake:
“If the data is correct, it should speak for itself.”
Data never speaks for itself.
People listen selectively.
Different audiences care about:
🗣️ You Don’t Report Research — You Translate It
A researcher might ask:
A manager asks:
A teammate asks:
A journalist asks:
🤝 Your job is not to change the insight — it’s to change the framing.
| Audience | Cares Most About | Needs to Hear |
|---|---|---|
| Peers | Rigor | How it was done |
| Managers | Outcomes | What changes |
| Teammates | Execution | What’s next |
| Public | Meaning | Why it matters |
🐾 Same data. Different audience. Different story.
| Audience | Focus On | Tone & Format |
|---|---|---|
| Leadership / Decision-makers | Actionable outcomes, ROI, trends | Executive summary, visuals, concise takeaways |
| Technical Teams | Methodology, reliability, detail | Reports, code appendices, technical visualisations |
| Students / Community | Relevance, human impact | Narratives, infographics, relatable visuals |
🎨 Effective storytelling adapts to who’s listening — not who’s speaking.
Every insight presentation should:
✨ Numbers tell the “what.” Storytelling explains the “so what.”
“Only 40% of students regularly use online discussion boards.”
Rewrite the insight for two audiences (not all three):
Each rewrite must include:
Compare:
🔹 Overall Message: Data work is not finished when the analysis is complete — it is finished only when it changes a decision, improves a system, or informs the next question.
📚 Take one insight from M7 and design a small action — then decide how you’d know if it worked.
This module frames research and analysis as an ongoing cycle in which questions, actions, and feedback continuously inform one another. Learners distinguish clearly between insight and impact, recognising that correct or significant findings do not automatically lead to change. Through practical examples, the module demonstrates how feedback reveals blindspots, constraints, and opportunities for extension, strengthening both the research question and the resulting actions.
The module also emphasises the importance of audience-aware communication. Learners develop the ability to translate the same insight for different stakeholders by adjusting focus, language, and format while preserving the underlying evidence. By the end of the module, learners are equipped to treat feedback as data, actions as tests, and communication as a core component of responsible, high-impact research practice.
The concepts in this module connect directly to practical data handling and exploration in Python.
| Submodule | Python Connection | Why It Matters |
|---|---|---|
| The Circle of Analysis | Version analyses and rerun models with new data slices (df.query(), parameterised notebooks) |
Reinforces iteration and shows how new questions emerge from actions. |
| Insight vs. Impact | Build simple KPI summaries and decision dashboards (groupby(), aggregations) |
Connects insights directly to outcomes and measurable change. |
| The Feedback Engine | Run follow-up analyses, A/B tests, or sensitivity checks (scipy.stats, resampling) |
Treats feedback as structured data for refinement rather than anecdote. |
| The Audience Pivot | Export different visuals and summaries (plt.savefig(), multiple chart styles) |
Enables the same insight to be translated effectively for different stakeholders. |
📚 You can apply the same activities directly in Python to reinforce these concepts.